Exam 14: Statistical Process Control
Exam 1: Introduction to Statistics60 Questions
Exam 2: Exploring Data With Tables and Graphs60 Questions
Exam 3: Describing, Exploring, and Comparing Data60 Questions
Exam 4: Probability60 Questions
Exam 5: Discrete Probability Distributions60 Questions
Exam 6: Normal Probability Distributions60 Questions
Exam 7: Estimating Parameters and Determining Sample Sizes60 Questions
Exam 8: Hypothesis Testing60 Questions
Exam 9: Inferences From Two Samples60 Questions
Exam 10: Correlation and Regression60 Questions
Exam 11: Goodness-Of-Fit and Contingency Tables60 Questions
Exam 12: Analysis of Variance59 Questions
Exam 13: Nonparametric Tests60 Questions
Exam 14: Statistical Process Control60 Questions
Select questions type
Are control charts based on actual behavior or on desired behavior? Give an example to illustrate the difference between the two types of behavior.
(Essay)
4.9/5  (30)
(30)
Use the given process data to construct a control chart for p. A drugstore considers a wait of more than 5 minutes to be a defect. Each week 100 customers are randomly selected and
timed at the checkout line. The numbers of defects for 20 consecutive weeks are given below. 4 4 5 5 5 5 5 6 6 6 6 12 6 6 6 7 6 7 8 7
(Essay)
5.0/5 (37)
Examine the given run chart or control chart and determine whether the process is within statistical control. 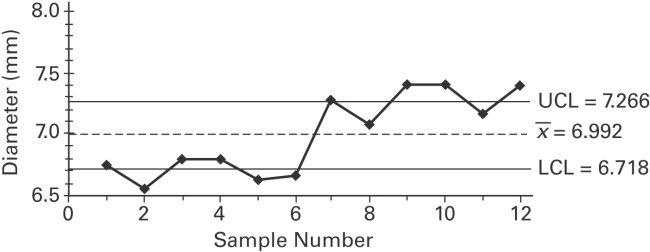
(Multiple Choice)
4.8/5 (38)
A _________________ is a sequential plot of individual data values over time. One axis is used for the data values, and the other axis is used for the time sequence.
(Multiple Choice)
4.8/5 (43)
Control charts are used to monitor changing characteristics of data over ____________.
(Multiple Choice)
4.8/5 (33)
Define statistically stable (or "within statistical control"). Show examples of run charts which illustrate processes which are not statistically controlled. Discuss the pattern which indicates
the process is not statistically controlled for each example.
(Essay)
4.9/5 (32)
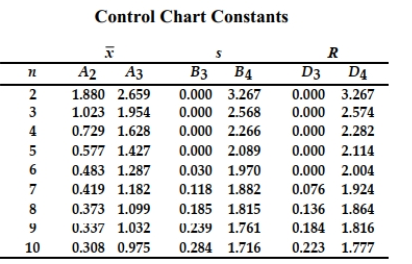
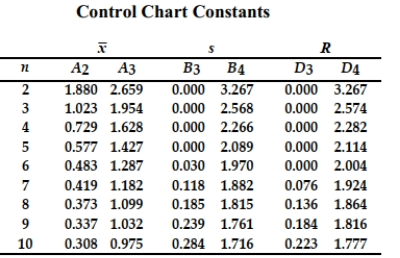
A machine is supposed to fill boxes to a weight of 50 pounds. Every 30 minutes a sample of four boxes is tested; the results are given below. What would be the value of the centerline that would be used in creating an R chart? 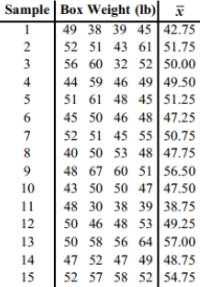
(Multiple Choice)
4.9/5 (34)
Examine the given run chart or control chart and determine whether the process is within statistical control. If it is not, identify which of the three out-of-statistical-control criteria apply. 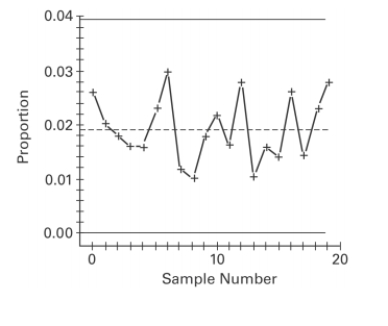
(Essay)
4.8/5 (33)
Construct an chart and determine whether the process variation is within statistical control.
 A machine that is supposed to produce ball bearings with a diameter of 7 millimeters yields the following data from a test of 5 ball bearings every 20 minutes.
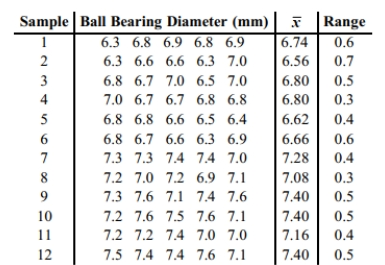
(Essay)
4.9/5 (33)
Define statistically stable (or "within statistical control"). Show examples of run charts which illustrate processes which are not statistically controlled. Discuss the pattern which indicates
the process is not statistically controlled for each example.
(Essay)
4.8/5 (32)
Construct an chart and determine whether the process variation is within statistical control.
 A machine is supposed to fill cans that contain 12 ounces. Each hour, a sample of four cans is tested; the results of 15 consecutive hours are given below.
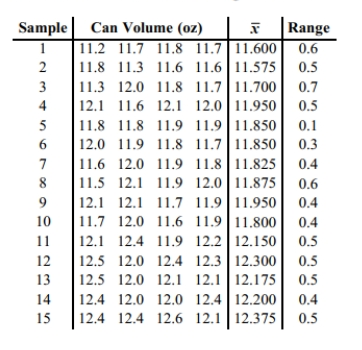
(Essay)
5.0/5 (41)
Examine the given run chart or control chart and determine whether the process is within statistical control. 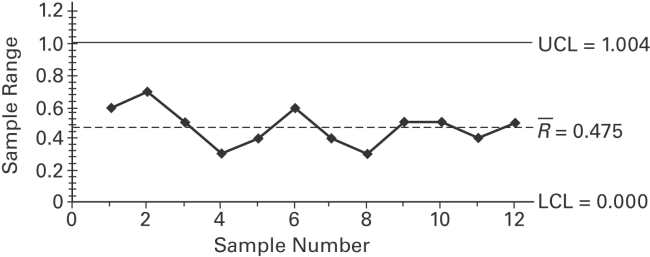
(Multiple Choice)
4.8/5 (36)
Sketch a run chart that that indicates that a process is not statistically stable due to increasing variation.
(Essay)
4.7/5 (32)
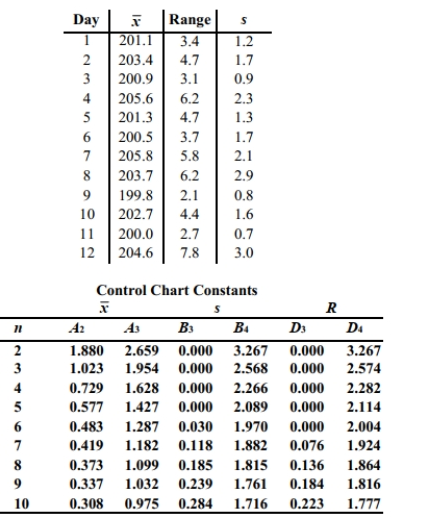
A manufacturer of lightbulbs picks 10 lightbulbs at random each day for quality control. The mean and range (in hours) of the lifetimes of the 10 lightbulbs are calculated. The results for 12 consecutive days are shown in the table below. Construct an R chart to determine whether the process is in statistical control.
(Multiple Choice)
4.8/5 (34)
Provide an appropriate response. Describe what process data are. Why are process data important to businesses? What is a common goal of businesses using quality control?
(Essay)
4.9/5 (35)
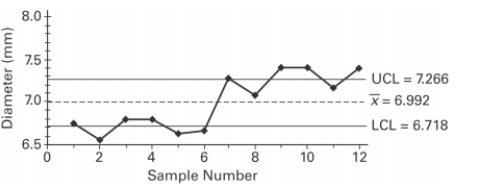
A control chart for is shown below. Determine whether the process mean is within statistical control. If it is not, identify which of the three out-of-control criteria lead to rejection of a statistically stable mean.
(Essay)
4.8/5 (39)
Use the given process data to construct a control chart for p. A manufacturer monitors the level of defects in the television sets that it produces. Each week, 200 television sets are randomly
selected and tested and the number of defects is recorded. The results for 12 consecutive weeks
are shown below.
4 7 5 6 8 3 12 4 4 5 6 2
(Essay)
4.7/5 (35)
Examine the given run chart or control chart and determine whether the process is within statistical control. If it is not, identify which of the three out-of-statistical-control
criteria apply. 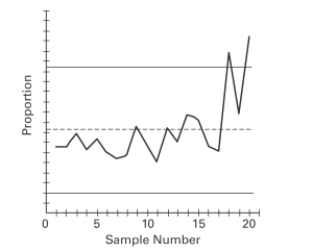
(Essay)
4.7/5 (44)
Filters
- Essay(0)
- Multiple Choice(0)
- Short Answer(0)
- True False(0)
- Matching(0)