Exam 12: Multiple Regression and Model Building
Exam 1: Statistics, Data, and Statistical Thinking77 Questions
Exam 2: Methods for Describing Sets of Data187 Questions
Exam 3: Probability284 Questions
Exam 4: Discrete Random Variables134 Questions
Exam 5: Continuous Random Variables138 Questions
Exam 6: Sampling Distributions52 Questions
Exam 7: Inferences Based on a Single Sample: Estimation With Confidence Intervals125 Questions
Exam 8: Inferences Based on a Single144 Questions
Exam 9: Inferences Based on Two Samples: Confidence Intervals and Tests of Hypotheses100 Questions
Exam 10: Analysis of Variance: Comparing More Than Two Means91 Questions
Exam 11: Simple Linear Regression113 Questions
Exam 12: Multiple Regression and Model Building131 Questions
Exam 13: Categorical Data Analysis60 Questions
Exam 14: Nonparametric Statistics Available Online87 Questions
Select questions type
A collector of grandfather clocks believes that the price received for the clocks at an auction increases with the number of bidders, but at an increasing (rather than a constant)rate. Thus, the
Model proposed to best explain auction price (y, in dollars)by number of bidders (x)is the
Quadratic model
This model was fit to data collected for a sample of 32 clocks sold at auction; the resulting estimate of was .
Interpret this estimate of .
(Multiple Choice)
4.8/5  (39)
(39)
Consider the partial printout for an interaction regression analysis of the relationship between a dependent variable and two independent variables and .
ANOVA
df SS MS F Significance F Regression 3 3393.677324 1131.225775 9391.974782 2.11084-11 Residual 6 0.722675987 0.120445998 Total 9 3394.4
Coefficients Standard Error t Stat P-value Lower 95\% Upper 95\% Intercept 16.72197014 8.283997219 2.018587126 0.09007654 -3.548255659 36.99219593 1 -3.037317759 2.678748705 -1.133856921 0.300116382 -9.591984506 3.517348987 2 -1.046522754 1.547132645 -0.676427297 0.523973988 -4.832222727 2.73917722 12 4.071685147 0.444059933 9.169224345 9.47663-05 2.98510884 5.158261454
a. Write the prediction equation for the interaction model.
b. Test the overall utility of the interaction model using the global -test at .
c. Test the hypothesis (at that and interact positively.
d. Estimate the change in for each additional 1 -unit increase in when .
(Essay)
4.7/5 (32)
When testing the utility of the quadratic model , the most important tests involve the null hypotheses and .
(True/False)
4.9/5 (31)
A study of the top MBA programs attempted to predict the average starting salary (in $1000ʹs)of graduates of the program based on the amount of tuition (in $1000ʹs)charged by the program and
The average GMAT score of the programʹs students. The results of a regression analysis based on a
Sample of 75 MBA programs is shown below: Least Squares Linear Regression of Salary
Predictor
Variables Coefficient Std Error T P VIF Constant -203.402 51.6573 -3.94 0.0002 0.0 Gmat 0.39412 0.09039 4.36 0.0000 2.0 Tuition 0.92012 0.17875 5.15 0.0000 2.0 R-Squared 0.6857 Resid. Mean Square (MSE) 427.511 Adjusted R-Squared 0.6769 Standard Deviation 20.6763
Identify the test statistic that should be used to test to determine if the amount of tuition charged by a program is a useful predictor of the average starting salary of the graduates of the program.
(Multiple Choice)
4.9/5 (39)
As part of a study at a large university, data were collected on n = 224 freshmen computer science (CS)majors in a particular year. The researchers were interested in modeling y, a studentʹs grade
Point average (GPA)after three semesters, as a function of the following independent variables
(recorded at the time the students enrolled in the university): average high school grade in mathematics (HSM)
average high school grade in science (HSS)
average high school grade in English (HSE)
SAT mathematics score (SATM)
SAT verbal score (SATV)
A first-order model was fit to data.
A confidence interval for is . Interpret this result.
(Multiple Choice)
5.0/5 (31)
As part of a study at a large university, data were collected on n = 224 freshmen computer science (CS)majors in a particular year. The researchers were interested in modeling y, a studentʹs grade
Point average (GPA)after three semesters, as a function of the following independent variables
(recorded at the time the students enrolled in the university): = average high school grade in mathematics (HSM) = average high school grade in science (HSS) = average high school grade in English (HSE) = SAT mathematics score (SATM) = SAT verbal score (SATV)
A first-order model was fit to data with .
What is the correct interpretation of , the coefficient of determination for the model?
(Multiple Choice)
4.7/5 (34)
It is dangerous to predict outside the range of the data collected in a regression analysis. For instance, we shouldnʹt predict the price of a 5000 square foot home if all our sample homes were
Smaller than 4500 square feet. Which of the following multiple regression pitfalls does this example
Describe?
(Multiple Choice)
4.8/5 (34)
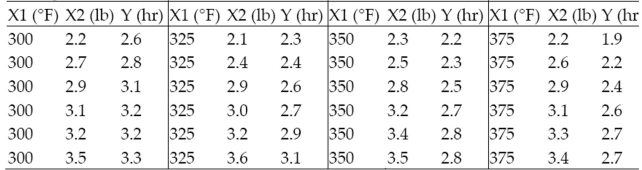
The staff of a test kitchen is attempting to determine the baking time, , of a roast, i.e., the time it takes the internal temperature of the roast to reach , using two variables, the temperature setting of the oven, , and the weight of the roast, , in pounds. The data for 24 roasts are shown below.
 a.
b. Do the data provide sufficient evidence to indicate that the second-order terms contribute information for the prediction of ? State the null and alternative hypothes
a.
b. Do the data provide sufficient evidence to indicate that the second-order terms contribute information for the prediction of ? State the null and alternative hypothes
(Essay)
4.7/5 (33)
The concessions manager at a beachside park recorded the high temperature, the number
of people at the park, and the number of bottles of water sold for each of 12 consecutive
Saturdays. The data are shown below. 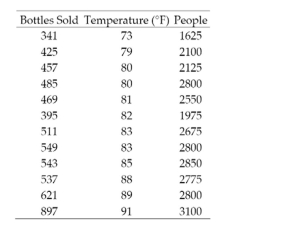 a. Fit the model to the data, letting represent the number of bottles of water sold, the temperature, and the number of people at the park.
b. Find the confidence interval for the mean number of bottles of water sold when the temperature is and there are 2700 people at the park.
c. Find the prediction interval for the number of bottles of water sold when the temperature is and there are 2700 people at the park.
a. Fit the model to the data, letting represent the number of bottles of water sold, the temperature, and the number of people at the park.
b. Find the confidence interval for the mean number of bottles of water sold when the temperature is and there are 2700 people at the park.
c. Find the prediction interval for the number of bottles of water sold when the temperature is and there are 2700 people at the park.
(Essay)
4.8/5 (31)
Retail price data for n = 60 hard disk drives were recently reported in a computer
magazine. Three variables were recorded for each hard disk drive: Retail PRICE (measured in dollars)
Microprocessor SPEED (measured in megahertz)
(Values in sample range from 10 to 40 )
CHIP size (measured in computer processing units)
(Values in sample range from 286 to 486 )
A first-order regression model. was fit to the data. Part of the printout follows:
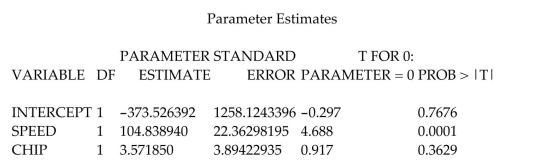 Identify and interpret the estimate of .
(Essay)
4.8/5 (38)
A first-order model may include terms for both quantitative and qualitative independent
variables.
(True/False)
4.8/5 (37)
A regression residual is the difference between an observed y value and its corresponding
predicted value.
(True/False)
4.7/5 (32)
The model was fit to a set of data.
A partial printout for the analysis follows:
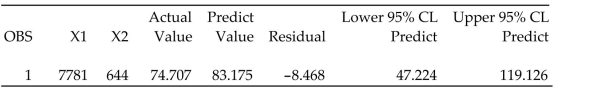 Interpret the value of the residual when and .
(Multiple Choice)
4.8/5 (35)
In situations where two competing models have essentially the same predictive power (as
determined by an F-test), it is standard procedure to use the model with the greater number of
parameters.
(True/False)
4.9/5 (29)
The model was fit to a set of data, and the following plot of residuals against values was obtained.
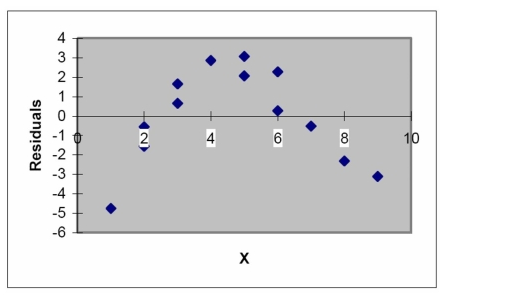 Interpret the residual plot.
(Essay)
4.9/5 (33)
The model was used to relate to a single qualitative variable, where
This model was fit to data points and the following result was obtained:
a. Use the least squares prediction equation to find the estimate of E(y)for each level of
the qualitative variable.
b. Specify the null and alternative hypothesis you would use to test whether E(y)is the
same for all levels of the independent variable.
(Essay)
4.9/5 (36)
Retail price data for n = 60 hard disk drives were recently reported in a computer
magazine. Three variables were recorded for each hard disk drive: Retail PRICE (measured in dollars)
Microprocessor SPEED (measured in megahertz)
(Values in sample range from 10 to 40 )
CHIP size (measured in computer processing units)
(Values in sample range from 286 to 486 )
A first-order regression model was fit to the data. Part of the printout follows:
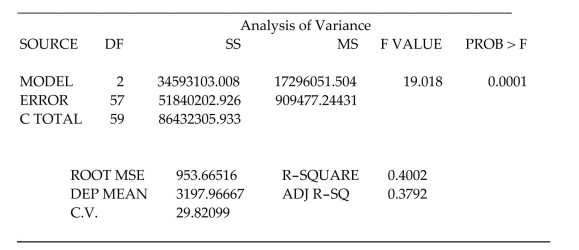 Test to determine if the model is adequate for predicting the price of a computer. Use .
(Essay)
4.9/5 (40)
A college admissions officer proposes to use regression to model a studentʹs college GPA
at graduation in terms of the following two variables: = high school GPA = SAT score The admissions officer believes the relationship between college GPA and high school
GPA is linear and the relationship between SAT score and college GPA is linear. She also
believes that the relationship between college GPA and high school GPA depends on the
studentʹs SAT score. Write the regression model she should fit.
(Essay)
4.8/5 (52)
A collector of grandfather clocks believes that the price received for the clocks at an auction increases with the number of bidders, but at an increasing (rather than a constant)rate. Thus, the
Model proposed to best explain auction price (y, in dollars)by number of bidders (x)is the
Quadratic model
This model was fit to data collected for a sample of 32 clocks sold at auction; a portion of the printout follows:
PARAMETER STANDARD T FOR 0; VARIABLES ESTIMATE ERROR PARAMETER =0 PROB >\mid INTERCEPT 286.42 9.66 .31 .06 29.64 .0001 \cdot -.000067 .00007 5.14 .0016
Give the -value for testing against .
(Multiple Choice)
4.8/5 (41)
A qualitative variable whose outcomes are assigned numerical values is called a coded variable.
(True/False)
4.8/5 (41)
Filters
- Essay(0)
- Multiple Choice(0)
- Short Answer(0)
- True False(0)
- Matching(0)