Exam 12: Multiple Regression and Model Building
Exam 1: Statistics, Data, and Statistical Thinking77 Questions
Exam 2: Methods for Describing Sets of Data187 Questions
Exam 3: Probability284 Questions
Exam 4: Discrete Random Variables134 Questions
Exam 5: Continuous Random Variables138 Questions
Exam 6: Sampling Distributions52 Questions
Exam 7: Inferences Based on a Single Sample: Estimation With Confidence Intervals125 Questions
Exam 8: Inferences Based on a Single144 Questions
Exam 9: Inferences Based on Two Samples: Confidence Intervals and Tests of Hypotheses100 Questions
Exam 10: Analysis of Variance: Comparing More Than Two Means91 Questions
Exam 11: Simple Linear Regression113 Questions
Exam 12: Multiple Regression and Model Building131 Questions
Exam 13: Categorical Data Analysis60 Questions
Exam 14: Nonparametric Statistics Available Online87 Questions
Select questions type
The rejection of the null hypothesis in a global F-test means that the model is the best model for
providing reliable estimates and predictions.
(True/False)
4.9/5  (46)
(46)
Consider the interaction model . Find the slope of the line relating and when .
(Multiple Choice)
4.7/5 (34)
For any given model fit to a data set, the sum of the residuals is 0.
(True/False)
5.0/5 (35)
During its manufacture, a product is subjected to four different tests in sequential order. An efficiency expert claims that the fourth (and last) test is unnecessary since its results can be predicted based on the first three tests. To test this claim, multiple regression will be used to model Test4 score , as a function of Test1 score , Test 2 score , and Test3 score ). [Note: All test scores range from 200 to 800 , with higher scores indicative of a higher quality product.] Consider the model:
The global statistic is used to test the null hypothesis, . Describe this hypothesis in words.
(Multiple Choice)
4.9/5 (38)
It is desired to build a regression model to predict the sales price of a single family home, based on the neighborhood the home is located in. The goal is to compare the prices of homes that are located in four different neighborhoods. Which regression model should be built?
(Multiple Choice)
4.8/5 (43)
There are four independent variables, , and , that might be useful in predicting a response . A total of observations is available, and it is decided to employ stepwise regression to help in selecting the independent variables that appear to useful. The computer fits all possible one-variable models of the form . The information in the table is provided from the computer printout.
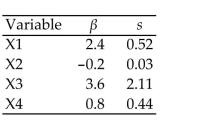 Which independent variable is declared the best one-variable predictor of ?
(Multiple Choice)
4.8/5 (37)
Consider the data given in the table below. 1 4 2 6 2 5 3 7 4 7 4 6 5 4 5 5 6 3
a. Plot the data on a scattergram. Does a quadratic model seem to be a good fit for the data? Explain.
b. Use the method of least squares to find a quadratic prediction equation.
c. Graph the prediction equation on your scattergram.
(Essay)
4.8/5 (34)
In the presence of multicollinearity, you should avoid making inferences about the parameters
based on the t-tests.
(True/False)
4.9/5 (28)
A public health researcher wants to use regression to predict the sun safety knowledge of pre-school children. The researcher randomly sampled 35 preschoolers, assigned them to one of
Two groups, and then measured the following three variables: SUNSCORE: Score on sun-safety comprehension test
READING: Reading comprehension score
GROUP: if child received a Be Sun Safe demonstration, 0 if not
A regression model was fit and the following residual plot was observed.
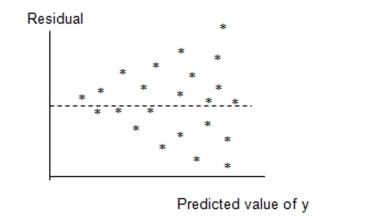 Which of the following assumptions appears violated based on this plot?
(Multiple Choice)
5.0/5 (36)
In the presence of multicollinearity, the predicted values of are actually quite good for values of far outside the range of the sampled values of .
(True/False)
5.0/5 (38)
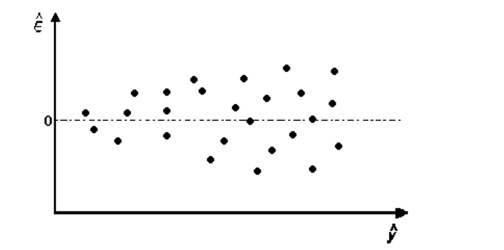
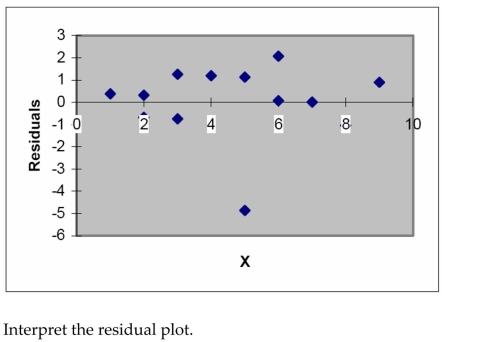
Suppose that the following model was fit to a set of data.
The corresponding plot if residuals against predicted values is shown. Interpret the plot.
(Multiple Choice)
4.7/5 (32)
Stepwise regression is used to determine which variables, from a large group of variables, are
useful in predicting the value of a dependent variable.
(True/False)
4.8/5 (38)
Consider the data given in the table below. 1 7 2 6 2 5 3 5 3 4 4 4 4 3 4 2 5 4 5 5 6 6 Plot the data on a scattergram. Does a second-order model seem to be a good fit for the data? Explain.
(Essay)
4.9/5 (40)
A public health researcher wants to use regression to predict the sun safety knowledge of pre-school children. The researcher randomly sampled 35 preschoolers, assigned them to one of
Two groups, and then measured the following three variables: SUNSCORE: Score on sun-safety comprehension test
READING: Reading comprehension score
GROUP: if child received a Be Sun Safe demonstration, 0 if not
The following two models were hypothesized:
Model 1: E(y)=+++++ Model 2: E(y)=+++
A partial f-test was conducted to compare the two models and the resulting p-value was found to be . Fill in the blank. The results lead us to conclude that there is (at ).
(Multiple Choice)
4.8/5 (34)
The independent variables and interact when the effect on of a change in depends on .
(True/False)
4.8/5 (39)
Retail price data for n = 60 hard disk drives were recently reported in a computer magazine. Three variables were recorded for each hard disk drive: Retail PRICE (measured in dollars)
Microprocessor SPEED (measured in megahertz)
(Values in sample range from 10 to 40 )
CHIP size (measured in computer processing units)
(Values in sample range from 286 to 486 )
a first-order regression model was fit to the data. Part of the printout follows:
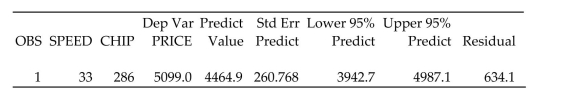 Interpret the interval given in the printout.
(Multiple Choice)
4.9/5 (35)
What relationship between x and y is suggested by the scattergram? 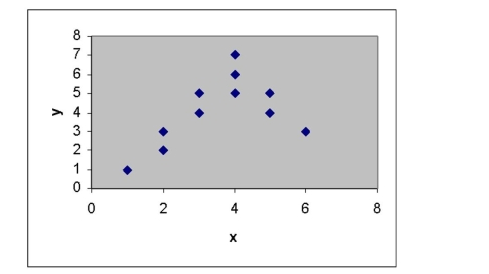
(Multiple Choice)
4.8/5 (36)
A college admissions officer proposes to use regression to model a studentʹs college GPA
at graduation in terms of the following two variables:
x1 = high school GPA
x2 = SAT score
The admissions officer believes the relationship between college GPA and high school
GPA is linear and the relationship between SAT score and college GPA is linear. She also
believes that the relationship between college GPA and high school GPA depends on the
studentʹs SAT score. She proposes the regression model: Explain how to determine if the relationship between college GPA and SAT score depends
on the high school GPA.
(Essay)
4.9/5 (31)
Operations managers often use work sampling to estimate how much time workers spend
on each operation. Work sampling-which involves observing workers at random points
in time-was applied to the staff of the catalog sales department of a clothing
manufacturer. The department applied regression to the following data collected for 40
consecutive working days: TIME: Time spent (in hours) taking telephone orders during the day
ORDERS: Number of telephone orders received during the day
WEEK: weekday, 0 if Saturday or Sunday
Consider the complete 2 nd-order model:
Explain how to conduct a test to determine if a quadratic relationship between total order
time and the number of orders taken is necessary in the regression model above. Specify
the null and alternative hypotheses that are to be tested.
(Essay)
4.8/5 (41)
The model was fit to a set of data, and the following plot of residuals against values was obtained.
(Essay)
4.9/5 (42)
Filters
- Essay(0)
- Multiple Choice(0)
- Short Answer(0)
- True False(0)
- Matching(0)