Exam 9: Introduction to Hypothesis Testing
Exam 1: The Where, Why, and How of Data Collection167 Questions
Exam 2: Graphs, Charts and Tablesdescribing Your Data138 Questions
Exam 3: Describing Data Using Numerical Measures138 Questions
Exam 4: Introduction to Probability125 Questions
Exam 5: Discrete Probability Distributions161 Questions
Exam 6: Introduction to Continuous Probability Distributions122 Questions
Exam 7: Introduction to Sampling Distributions136 Questions
Exam 8: Estimating Single Population Parameters174 Questions
Exam 9: Introduction to Hypothesis Testing183 Questions
Exam 10: Estimation and Hypothesis Testing for Two Population Parameters121 Questions
Exam 11: Hypothesis Tests and Estimation for Population Variances69 Questions
Exam 12: Analysis of Variance162 Questions
Exam 13: Goodness-Of-Fit Tests and Contingency Analysis105 Questions
Exam 14: Introduction to Linear Regression and Correlation Analysis139 Questions
Exam 15: Multiple Regression Analysis and Model Building148 Questions
Exam 16: Analyzing and Forecasting Time-Series Data131 Questions
Exam 17: Introduction to Nonparametric Statistics103 Questions
Exam 18: Introducing Business Analytics48 Questions
Exam 19: Introduction to Decision Analysis48 Questions
Exam 20: Introduction to Quality and Statistical Process Control42 Questions
Select questions type
A conclusion to "not reject" the null hypothesis is the same as the decision to "accept the null hypothesis".
(True/False)
4.9/5  (25)
(25)
Waiters at Finegold's Restaurant and Lounge earn most of their income from tips. Each waiter is required to "tip-out" a portion of tips to the table bussers and hostesses. The manager has based the "tip- out" rate on the assumption that the mean tip is at least 15% of the customer bill. To make sure that this is the correct assumption, he has decided to conduct a test by randomly sampling 60 bills and recording the actual tips. Calculate the probability of a Type II error if the true mean is 14%. Assume that the population standard deviation is known to be 2% and that a significance level equal to 0.01 will be used to conduct the hypothesis test.
(Multiple Choice)
4.9/5 (42)
Woof Chow Dog Food Company believes that it has a market share of 25 percent. It surveys n = 100 dog owners and ask whether or not Woof Chow is their regular brand of dog food, and 23 people say yes. Based upon this information, what is the value of the test statistic?
(Multiple Choice)
4.7/5 (36)
A major package delivery company claims that at least 95 percent of the packages it delivers reach the destination on time. As part of the evidence in a lawsuit against the package company, a random sample of n = 200 packages was selected. A total of 188 of these packages were delivered on time. Using a significance level of .05, the test statistic for this test is approximately z = -0.65.
(True/False)
4.8/5 (38)
For the following z-test statistic, compute the p-value assuming that the hypothesis test is a one- tailed test: z = 2.09.
(Multiple Choice)
4.8/5 (34)
For the following z-test statistic, compute the p-value assuming that the hypothesis test is a one- tailed test: z = 1.34.
(Multiple Choice)
4.9/5 (38)
Type II error is failing to reject the null hypothesis when the null is actually false.
(True/False)
4.8/5 (36)
A toy store that has a 12% market share launches a marketing campaign. At the end of the campaign period the company conducts a survey in order to assess whether its market share has increased. If this claim is to be tested, the null and alternative hypotheses are: H0 : p = 12% Ha : p > 12%
(True/False)
4.8/5 (33)
A national car rental chain believes that more than 80 percent of its customers are satisfied with the check-in process that the company is using. To test this, a random sample of n = 200 customers are surveyed. These sample results show 168 that say they were satisfied. If the test is to be conducted using a .05 level of significance, what is the critical value?
(Essay)
4.9/5 (39)
To calculate beta requires making a "what if" assumption about the true population parameter, where the "what-if" value is one that would cause the null hypothesis to be false.
(True/False)
4.9/5 (27)
Suppose we want to test H0 : μ ≥ 30 versus H1 : μ < 30. Which of the following possible sample results based on a sample of size 36 gives the strongest evidence to reject H0 in favor of H1?
(Multiple Choice)
4.7/5 (38)
A mail-order business prides itself in its ability to fill customers' orders in six calendar days or less on the average. Periodically, the operations manager selects a random sample of customer orders and determines the number of days required to fill the orders. Based on this sample information, he decides if the desired standard is not being met. He will assume that the average number of days to fill customers' orders is six or less unless the data suggest strongly otherwise. On one occasion where a sample of 40 customers was selected, the average number of days was 6.65, with a sample standard deviation of 1.5 days. Can the operations manager conclude that his mail-order business is achieving its goal? Use a significance level of 0.025 to answer this question. Conduct the test using this p-value.
(Multiple Choice)
4.8/5 (41)
If the probability of a Type I error is set at 0.05, then the probability of a Type II error will be 0.95.
(True/False)
4.8/5 (37)
According to data from the Environmental Protection Agency, the average daily water consumption for a household of four people in the United States is approximately at least 243 gallons. (Source:http://www.catskillcenter.org/programs/csp/H20/Lesson3/house3.htm) Suppose a state agency plans to test this claim using an alpha level equal to 0.05 and a random sample of 100 households with four people. State the appropriate null and alternative hypotheses.
(Multiple Choice)
4.8/5 (29)
A major airline has stated in an industry report that its mean onground time between domestic flights is less than 18 minutes. To test this, the company plans to sample 36 randomly selected flights and use a significance level of 0.10. Assuming that the population standard deviation is known to be 4.0 minutes, the probability that the null hypothesis will be "accepted" if the true population mean is 16 minutes is approximately 0.955.
(True/False)
4.9/5 (32)
The makers of Mini-Oats Cereal have an automated packaging machine that can be set at any targeted fill level between 12 and 32 ounces. Every box of cereal is not expected to contain exactly the targeted weight, but the average of all boxes filled should. At the end of every shift (eight hours), 16 boxes are selected at random and the mean and standard deviation of the sample are computed. Based on these sample results, the production control manager determines whether the filling machine needs to be readjusted or whether it remains all right to operate. At the end of a particular shift during which the machine was filling 24-ounce boxes of Mini-Oats, the sample mean of 16 boxes was 24.32 ounces, with a standard deviation of 0.70 ounce. Assist the production control manager in determining if the machine is achieving its targeted average using test statistic and critical value t. Conduct the test using a p-value.
(Multiple Choice)
4.8/5 (27)
A local medical center has advertised that the mean wait for services will be less than 15 minutes. Given this claim, the hypothesis test for the population mean should be a one-tailed test with the rejection region in the lower (left-hand) tail of the sampling distribution.
(True/False)
4.8/5 (31)
A report recently submitted to the managing partner for a market research company stated "the hypothesis test may have resulted in either a Type I or a Type II error. We won't know which one occurred until later." This statement is one that we might correctly make for any hypothesis that we have conducted.
(True/False)
4.8/5 (32)
For the following hypothesis test 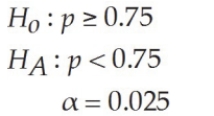 With n = 100 and p = 0.66, state the conclusion.
(Multiple Choice)
4.9/5 (33)
Filters
- Essay(0)
- Multiple Choice(0)
- Short Answer(0)
- True False(0)
- Matching(0)