Exam 14: Introduction to Linear Regression and Correlation Analysis
Exam 1: The Where, Why, and How of Data Collection167 Questions
Exam 2: Graphs, Charts and Tablesdescribing Your Data138 Questions
Exam 3: Describing Data Using Numerical Measures138 Questions
Exam 4: Introduction to Probability125 Questions
Exam 5: Discrete Probability Distributions161 Questions
Exam 6: Introduction to Continuous Probability Distributions122 Questions
Exam 7: Introduction to Sampling Distributions136 Questions
Exam 8: Estimating Single Population Parameters174 Questions
Exam 9: Introduction to Hypothesis Testing183 Questions
Exam 10: Estimation and Hypothesis Testing for Two Population Parameters121 Questions
Exam 11: Hypothesis Tests and Estimation for Population Variances69 Questions
Exam 12: Analysis of Variance162 Questions
Exam 13: Goodness-Of-Fit Tests and Contingency Analysis105 Questions
Exam 14: Introduction to Linear Regression and Correlation Analysis139 Questions
Exam 15: Multiple Regression Analysis and Model Building148 Questions
Exam 16: Analyzing and Forecasting Time-Series Data131 Questions
Exam 17: Introduction to Nonparametric Statistics103 Questions
Exam 18: Introducing Business Analytics48 Questions
Exam 19: Introduction to Decision Analysis48 Questions
Exam 20: Introduction to Quality and Statistical Process Control42 Questions
Select questions type
If a set of data contains no values of x that are equal to zero, then the regression coefficient, b0, has no particular meaning.
(True/False)
4.9/5  (29)
(29)
In a simple regression model, the slope coefficient represents the average change in the independent variable for a one-unit change in the dependent variable.
(True/False)
4.8/5 (35)
A manufacturing company is interested in predicting the number of defects that will be produced each hour on the assembly line. The managers believe that there is a relationship between the defect rate and the production rate per hour. The managers believe that they can use production rate to predict the number of defects. The following data were collected for 10 randomly selected hours. 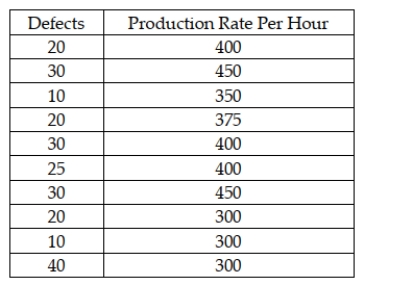 Given these sample data, the simple linear regression model for predicting the number of defects is approximately = 5.67 + 0.048x.
(True/False)
4.9/5 (42)
The fact that teachers' salaries in Wisconsin are correlated with egg prices in Texas means that the two variables are spuriously correlated since a change in one variable could not cause the change in the other.
(True/False)
4.8/5 (33)
When regression analysis is used for descriptive purposes, two of the main items of interest are whether the sign on the regression slope coefficient is positive or negative and whether the regression slope coefficient is significantly different from zero.
(True/False)
4.9/5 (40)
Consider the following partially completed computer printout for a regression analysis where the dependent variable is the price of a personal computer and the independent variable is the size of the hard drive. 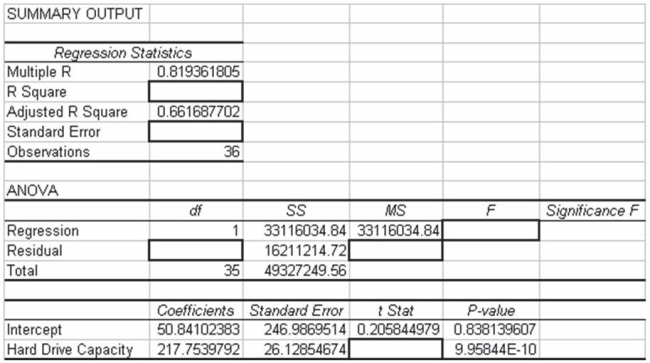 Based on the information provided, what is the F statistic?
(Multiple Choice)
4.8/5 (31)
The prediction interval developed from a simple linear regression model will be at its narrowest point when the value of x used to predict y is equal to the mean value of x.
(True/False)
4.9/5 (45)
Explain what the correlation coefficient measures and some detail of the key issues associated with it. Be sure to also discuss the concept of spurious correlation.
(Essay)
4.8/5 (33)
The standard error of the estimate for a simple linear regression model measures the variation in the slope coefficient from sample to sample.
(True/False)
4.8/5 (35)
In conducting a hypothesis test on the correlation between a pair of variables, we assume that each variable is normally and independently distributed.
(True/False)
4.8/5 (34)
State University recently randomly sampled ten students and analyzed grade point average (GPA) and number of hours worked off-campus per week. The following data were observed: 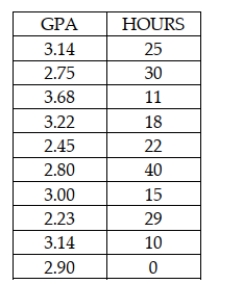 In this study the independent variable is the number of hours worked off campus per week.
(True/False)
4.9/5 (35)
Which of the following is a correct interpretation for the regression slope coefficient?
(Multiple Choice)
4.8/5 (30)
If the correlation between the dependent variable and the independent variable is negative, the standard error of the regression slope coefficient in a simple linear regression model will also be negative.
(True/False)
4.8/5 (28)
Given a sample correlation r = -0.5 and a sample size of n = 30, the test statistic for testing whether the two variables are significantly correlated is approximately t = -3.055.
(True/False)
4.9/5 (34)
A recent study of 15 shoppers showed that the correlation between the time spent in the store and the dollars spent was 0.235. Using a significance level equal to 0.05, which of the following is true?
(Multiple Choice)
4.8/5 (34)
When constructing a scatter plot, the dependent variable is placed on the vertical axis and the independent variable is placed on the horizontal axis.
(True/False)
4.9/5 (36)
A study was recently performed by the Internal Revenue Service to determine how much tip income waiters and waitresses should make based on the size of the bill at each table. A random sample of bills and resulting tips were collected. These data are shown as follows: 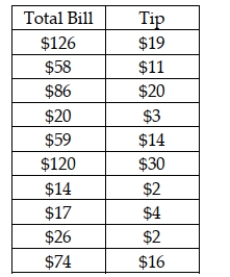 Based upon these data, what is the approximate predicted value for tips if the total bill is $100?
(Multiple Choice)
4.7/5 (38)
A research study has stated that the income earned by working individuals is correlated at a .64 value with the years of experience of the individual. Given this, the points of the scatter plot would fall on an inclined straight line that has a slope equal to .64.
(True/False)
4.8/5 (39)
The following regression output is available. Notice that some of the values are missing. 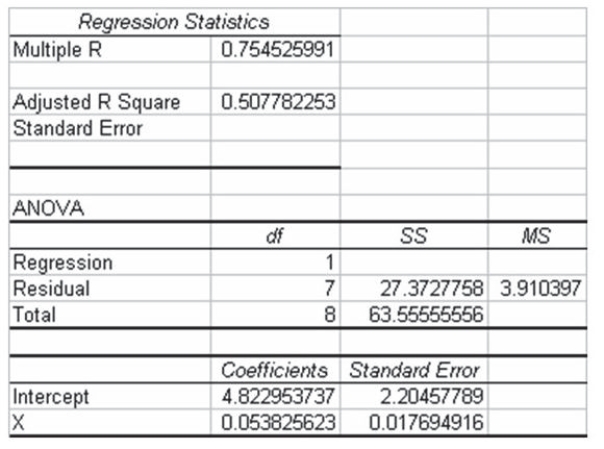 Given this information, what is the standard error of the estimate for the regression model?
(Multiple Choice)
4.8/5 (33)
If two variables are uncorrelated, the sample correlation coefficient will be r = 0.00.
(True/False)
4.8/5 (32)
Filters
- Essay(0)
- Multiple Choice(0)
- Short Answer(0)
- True False(0)
- Matching(0)