Exam 14: Introduction to Linear Regression and Correlation Analysis
Exam 1: The Where, Why, and How of Data Collection167 Questions
Exam 2: Graphs, Charts and Tablesdescribing Your Data138 Questions
Exam 3: Describing Data Using Numerical Measures138 Questions
Exam 4: Introduction to Probability125 Questions
Exam 5: Discrete Probability Distributions161 Questions
Exam 6: Introduction to Continuous Probability Distributions122 Questions
Exam 7: Introduction to Sampling Distributions136 Questions
Exam 8: Estimating Single Population Parameters174 Questions
Exam 9: Introduction to Hypothesis Testing183 Questions
Exam 10: Estimation and Hypothesis Testing for Two Population Parameters121 Questions
Exam 11: Hypothesis Tests and Estimation for Population Variances69 Questions
Exam 12: Analysis of Variance162 Questions
Exam 13: Goodness-Of-Fit Tests and Contingency Analysis105 Questions
Exam 14: Introduction to Linear Regression and Correlation Analysis139 Questions
Exam 15: Multiple Regression Analysis and Model Building148 Questions
Exam 16: Analyzing and Forecasting Time-Series Data131 Questions
Exam 17: Introduction to Nonparametric Statistics103 Questions
Exam 18: Introducing Business Analytics48 Questions
Exam 19: Introduction to Decision Analysis48 Questions
Exam 20: Introduction to Quality and Statistical Process Control42 Questions
Select questions type
Which of the following is NOT an assumption for the simple linear regression model?
(Multiple Choice)
4.9/5  (44)
(44)
A study was recently performed by the Internal Revenue Service to determine how much tip income waiters and waitresses should make based on the size of the bill at each table. A random sample of bills and resulting tips were collected and the following regression results were observed: SUMMARY OUTPUT 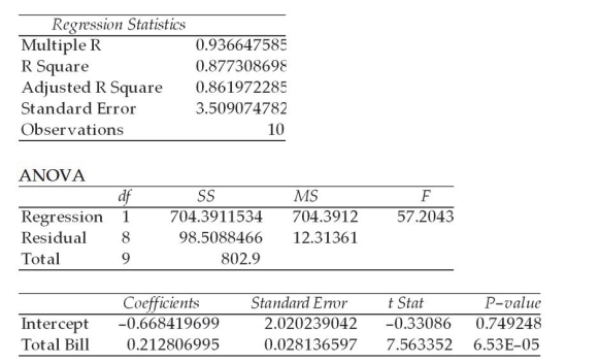 Given this output, the point estimate for the average tip per dollar amount of the bill is approximately $0.21.
(True/False)
4.9/5 (35)
In a study of 30 customers' utility bills in which the monthly bill was the dependent variable and the number of square feet in the house is the independent variable, the resulting regression model is = 23.40 + 0.4x. Given this, the sample correlation coefficient is known to be positive.
(True/False)
4.8/5 (34)
Use the following regression results to answer the question below. 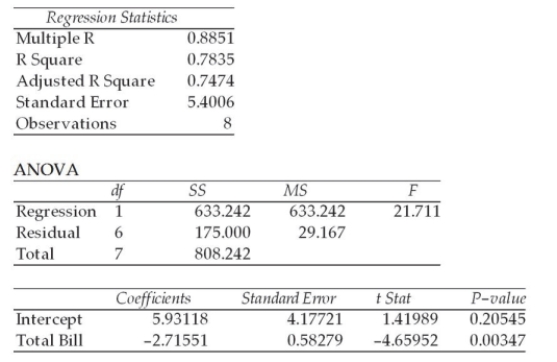 Which of the following is true?
(Multiple Choice)
4.8/5 (34)
If a residual plot exhibits a curved pattern in the residuals, this means that:
(Multiple Choice)
4.7/5 (36)
The sign on the intercept coefficient in a simple regression model will always be the same as the sign on the correlation coefficient.
(True/False)
4.7/5 (31)
A correlation of -0.9 indicates a weak linear relationship between the variables.
(True/False)
4.9/5 (43)
The following regression output is available. Notice that some of the values are missing. 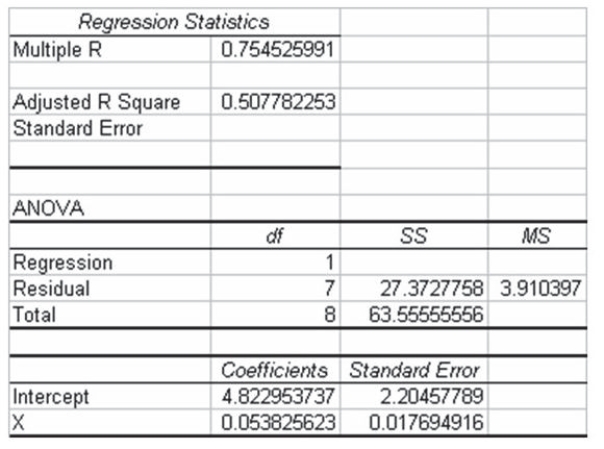 Given this information, what percent of the variation in the y variable is explained by the independent variable?
(Multiple Choice)
4.9/5 (37)
When the intercept in a regression equation is deemed not significantly different from 0, then in making predictions for y, 0.0 should be used as the value of the intercept rather than the estimated intercept value.
(True/False)
4.8/5 (29)
Assuming that a regression has been conducted for a group of small companies where x = the number of employees at the company, y = annual revenue of the company (recorded in thousands of dollars), and the largest company included in the study had 82 employees. The resulting regression equation is = 59.2 + 83.4x. Which of the following is true?
(Multiple Choice)
4.8/5 (28)
Consider the following partially completed computer printout for a regression analysis where the dependent variable is the price of a personal computer and the independent variable is the size of the hard drive. 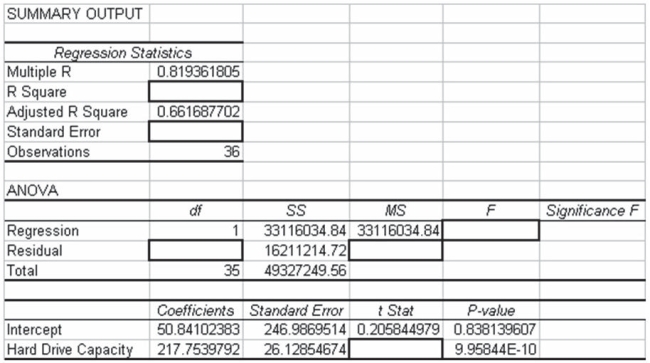 Based on the information provided, what percentage of the variation in the price of the personal computers is accounted for by the regression model using hard drive capacity as the independent variable?
(Multiple Choice)
4.8/5 (36)
Given the data below, one ran the simple regression analysis of Y on X. 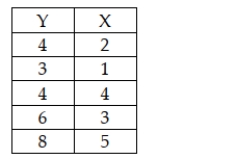 The relationship between Y and X is
(Multiple Choice)
4.8/5 (33)
In a simple linear regression analysis, if the test statistic for testing the significance of the regression slope coefficient is 3.6, the F ratio from the analysis of variance table is known to be 12.96
(True/False)
4.7/5 (32)
If the correlation between two variables in a simple linear regression model is calculated to be .73, the R-square value is .85.
(True/False)
4.9/5 (37)
A university study indicated that a correlation of -0.7 was found between the number of hours spent playing video games and a student's GPA. This means that the more time spent playing video games, the lower the overall GPA.
(True/False)
4.8/5 (40)
A bank is interested in determining whether its customers' checking balances are linearly related to their savings balances. A sample of n = 20 customers was selected and the correlation was calculated to be +0.40. If the bank is interested in testing to see whether there is a significant linear relationship between the two variables using a significance level of .05, the correct null and alternative hypotheses to test are: H0 : r = 0.0 Ha : r ≠ 0.0
(True/False)
4.8/5 (46)
The values of the regression coefficients are found such the sum of the residuals is minimized.
(True/False)
4.8/5 (39)
Given the following regression equation, the predicted value for y when x = 0.5 is about 4.57 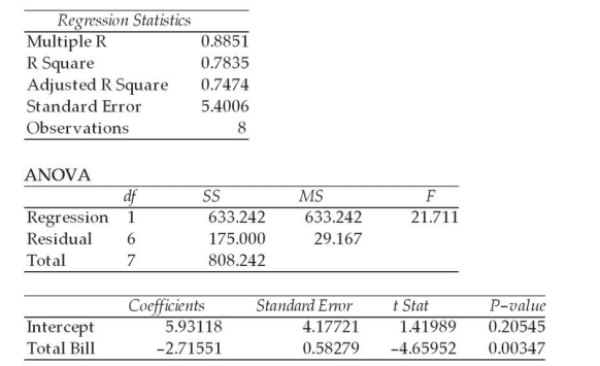
(True/False)
4.9/5 (39)
Filters
- Essay(0)
- Multiple Choice(0)
- Short Answer(0)
- True False(0)
- Matching(0)