Exam 14: Introduction to Linear Regression and Correlation Analysis
Exam 1: The Where, Why, and How of Data Collection167 Questions
Exam 2: Graphs, Charts and Tablesdescribing Your Data138 Questions
Exam 3: Describing Data Using Numerical Measures138 Questions
Exam 4: Introduction to Probability125 Questions
Exam 5: Discrete Probability Distributions161 Questions
Exam 6: Introduction to Continuous Probability Distributions122 Questions
Exam 7: Introduction to Sampling Distributions136 Questions
Exam 8: Estimating Single Population Parameters174 Questions
Exam 9: Introduction to Hypothesis Testing183 Questions
Exam 10: Estimation and Hypothesis Testing for Two Population Parameters121 Questions
Exam 11: Hypothesis Tests and Estimation for Population Variances69 Questions
Exam 12: Analysis of Variance162 Questions
Exam 13: Goodness-Of-Fit Tests and Contingency Analysis105 Questions
Exam 14: Introduction to Linear Regression and Correlation Analysis139 Questions
Exam 15: Multiple Regression Analysis and Model Building148 Questions
Exam 16: Analyzing and Forecasting Time-Series Data131 Questions
Exam 17: Introduction to Nonparametric Statistics103 Questions
Exam 18: Introducing Business Analytics48 Questions
Exam 19: Introduction to Decision Analysis48 Questions
Exam 20: Introduction to Quality and Statistical Process Control42 Questions
Select questions type
The following regression model has been computed based on a sample of twenty observations: = 34.2 + 19.3x. Given this model, the predicted value for y when x = 40 is 806.2.
(True/False)
4.9/5  (39)
(39)
Recently, an automobile insurance company performed a study of a random sample of 15 of its customers to determine if there is a positive relationship between the number of miles driven and the age of the driver. The sample correlation coefficient is r = .38. Given this information, which of the following is appropriate critical value for testing the null hypothesis at an alpha = .05 level?
(Multiple Choice)
5.0/5 (34)
An industry study was recently conducted in which the sample correlation between units sold and marketing expenses was 0.57. The sample size for the study included 15 companies. Based on the sample results, test to determine whether there is a significant positive correlation between these two variables. Use an alpha = 0.05
(Multiple Choice)
4.8/5 (35)
The National Football League has performed a study in which the total yards gained by teams in games was used as an independent variable to explain the variation in total points scored by teams during games. The points scored ranged from 0 to 57 and the yards gained ranged from 187 to 569. The following regression model was determined: = 12.3 + .12x Given this model, which of the following statements is true?
(Multiple Choice)
4.8/5 (40)
State University recently randomly sampled seven students and analyzed grade point average (GPA) and number of hours worked off-campus per week. The following data were observed: 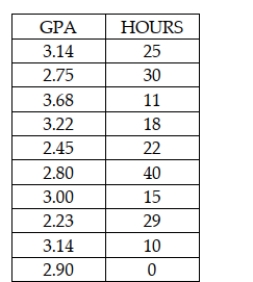 In testing the significance of the regression slope coefficient for the independent variable, HOURS, the calculated test statistic is approximately t = -1.47.
(True/False)
4.8/5 (45)
A high coefficient of determination (R2) implies that the regression model will be a good predictor for future values of the dependent variable given the value of the independent variable.
(True/False)
4.9/5 (31)
Two variables have a correlation coefficient that is very close to zero. This means that there is no relationship between the two variables.
(True/False)
4.8/5 (30)
A study was recently conducted by a Minor League Baseball team to determine whether there is a correlation between money spent at games on concessions and the game inning. In this study, the independent variable would be the game inning.
(True/False)
4.8/5 (36)
If a simple least squares regression model is developed based on a sample where the two variables are known to be positively correlated, the sum of the residuals will be positive.
(True/False)
4.9/5 (35)
Both a scatter plot and the correlation coefficient can distinguish between a curvilinear and a linear relationship.
(True/False)
4.8/5 (33)
Given a sample of size n = 15 and a sample correlation of r = 0.7, the value of the test statistic for conducting a hypothesis test of the correlation is t = 3.53.
(True/False)
4.8/5 (30)
A random sample of two variables, x and y, produced the following observations: 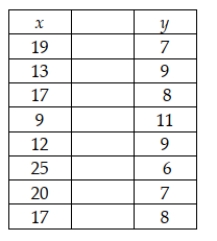 Test to determine whether the population correlation coefficient is negative. Use a significance level of 0.05 for the hypothesis test.
(Multiple Choice)
5.0/5 (30)
Recently, an automobile insurance company performed a study of a random sample of 15 of its customers to determine if there is a positive relationship between the number of miles driven and the age of the driver. The sample correlation coefficient is r = .38. Given this information, and assuming that the test is to be performed at the .05 level of significance, which of the following is the correct test statistic?
(Multiple Choice)
4.9/5 (38)
State University recently randomly sampled ten students and analyzed grade point average (GPA) and number of hours worked off-campus per week. The following data were observed: 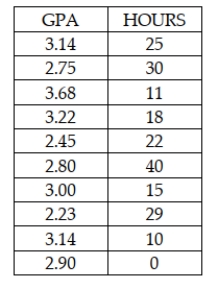 The test statistic for testing whether the two variables are significantly correlated is approximately z = 1.56.
(True/False)
5.0/5 (37)
If the correlation coefficient for two variables is computed to be a -0.70, the scatter plot will show the data to be downward sloping from left to right.
(True/False)
4.7/5 (22)
In developing a scatter plot, the decision maker has the option of connecting the points or not.
(True/False)
5.0/5 (31)
You are given the following sample data for two variables: 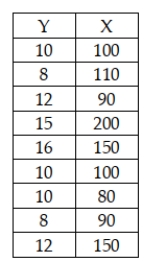 Based upon these sample data, and testing at the 0.05 level of significance, the critical value for testing whether the population correlation coefficient is equal to zero is t = 2.2622.
(True/False)
4.8/5 (27)
Filters
- Essay(0)
- Multiple Choice(0)
- Short Answer(0)
- True False(0)
- Matching(0)