Exam 14: Introduction to Linear Regression and Correlation Analysis
Exam 1: The Where, Why, and How of Data Collection167 Questions
Exam 2: Graphs, Charts and Tablesdescribing Your Data138 Questions
Exam 3: Describing Data Using Numerical Measures138 Questions
Exam 4: Introduction to Probability125 Questions
Exam 5: Discrete Probability Distributions161 Questions
Exam 6: Introduction to Continuous Probability Distributions122 Questions
Exam 7: Introduction to Sampling Distributions136 Questions
Exam 8: Estimating Single Population Parameters174 Questions
Exam 9: Introduction to Hypothesis Testing183 Questions
Exam 10: Estimation and Hypothesis Testing for Two Population Parameters121 Questions
Exam 11: Hypothesis Tests and Estimation for Population Variances69 Questions
Exam 12: Analysis of Variance162 Questions
Exam 13: Goodness-Of-Fit Tests and Contingency Analysis105 Questions
Exam 14: Introduction to Linear Regression and Correlation Analysis139 Questions
Exam 15: Multiple Regression Analysis and Model Building148 Questions
Exam 16: Analyzing and Forecasting Time-Series Data131 Questions
Exam 17: Introduction to Nonparametric Statistics103 Questions
Exam 18: Introducing Business Analytics48 Questions
Exam 19: Introduction to Decision Analysis48 Questions
Exam 20: Introduction to Quality and Statistical Process Control42 Questions
Select questions type
A study was done in which the high daily temperature and the number of traffic accidents within the city were recorded. These sample data are shown as follows: 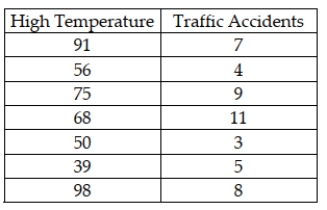 Given this data the sample correlation is:
(Multiple Choice)
4.7/5  (42)
(42)
Use the following regression results to answer the question below. 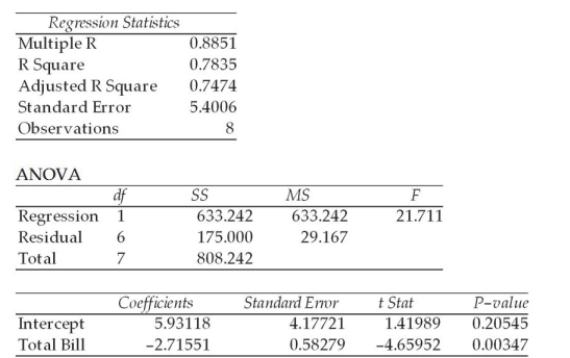 How many observations were involved in this regression?
(Multiple Choice)
4.8/5 (31)
Given a regression equation of = 16 + 2.3x we would expect that an increase in x of 2.0 would lead to an average increase of y of 4.6.
(True/False)
4.7/5 (39)
It is believed that number of people who attend a Mardi Gras parade each year depends on the temperature that day. A regression has been conducted on a sample of years where the temperature ranged from 28 to 64 degrees and the number of people attending ranged from 8400 to 14,600. The regression equation was found to be = 2378 + 191x. Which of the following is true?
(Multiple Choice)
4.9/5 (40)
The following regression output is available. Notice that some of the values are missing. 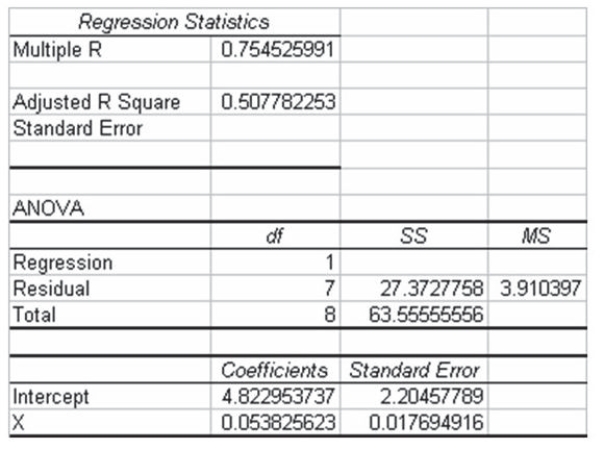 Given this information, what is the test statistic for testing whether the regression slope coefficient is equal to zero?
(Multiple Choice)
4.8/5 (33)
When a correlation is found between a pair of variables, this always means that there is a direct cause and effect relationship between the variables.
(True/False)
4.8/5 (30)
Explain why it is important to construct scatter plots prior to conducting regression analysis.
(Essay)
4.9/5 (30)
If it is known that a simple linear regression model explains 56 percent of the variation in the dependent variable and that the slope on the regression equation is negative, then we also know that the correlation between x and y is approximately -0.75.
(True/False)
4.8/5 (31)
Use the following regression results to answer the question below. 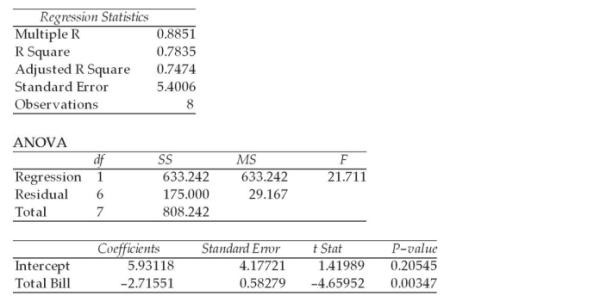 In conducting a hypothesis test of the slope using a 0.05 level of significance, which of the following is correct?
(Multiple Choice)
4.8/5 (30)
The scatter plot is a two dimensional graph that is used to graphically represent the relationship between two variables.
(True/False)
5.0/5 (45)
A national job placement company is interested in developing a model that might be used to explain the variation in starting salaries for college graduates based on the college GPA. The following data were collected through a random sample of the clients with which this company has been associated. 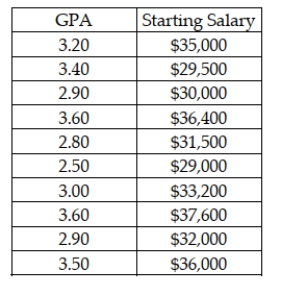 Based on this sample information, determine the least squares regression model, determine what percent of the variation in starting salaries is explained by GPA, and test to determine whether the regression model is statistically significant at the 0.05 level of significance. Also, develop a scatter plot of the data and locate the regression line on the scatter plot.
(Essay)
4.8/5 (42)
If the population correlation between two variables is determined to be -0.70, which of the following is known to be true?
(Multiple Choice)
4.8/5 (37)
Residual analysis is conducted to check whether regression assumptions are met. Which of the following is not an assumption made in simple linear regression?
(Multiple Choice)
5.0/5 (32)
If two variables are spuriously correlated, it means that the correlation coefficient between them is near zero.
(True/False)
4.9/5 (45)
State University recently randomly sampled ten students and analyzed grade point average (GPA) and number of hours worked off-campus per week. The following data were observed: 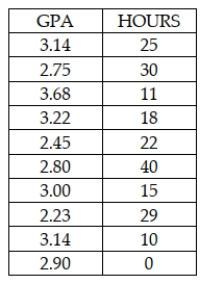 The correlation between these two variables is approximately -.461
(True/False)
4.9/5 (37)
In simple linear regression, the t-test for the slope and the F-test are both conducting the same hypothesis test.
(True/False)
4.8/5 (28)
A cellular phone service provider believes that there is negative correlation between the minutes used by its customers and the age of the customer. To test this, the following would be the appropriate null and alternative hypotheses: H0 : ρ = 0.0 Ha : ρ ≠ 0.0
(True/False)
4.9/5 (31)
A correlation coefficient computed from a sample of data values selected from a population is called a statistic and is subject to sampling error.
(True/False)
4.8/5 (44)
If the correlation between two variables is known to be statistically significant at the 0.05 level, then the regression slope coefficient will also be significant at the 0.05 level.
(True/False)
4.8/5 (36)
In a study of 30 customers' utility bills in which the monthly bill was the dependent variable and the number of square feet in the house is the independent variable, the resulting regression model is = 23.40 + 0.04x. Given this model, for a customer with a 2,000 square foot house and a monthly utility bill equal to $100.00, the residual from the regression model is approximately -$3.40.
(True/False)
4.9/5 (34)
Filters
- Essay(0)
- Multiple Choice(0)
- Short Answer(0)
- True False(0)
- Matching(0)