Exam 14: Introduction to Linear Regression and Correlation Analysis
Exam 1: The Where, Why, and How of Data Collection167 Questions
Exam 2: Graphs, Charts and Tablesdescribing Your Data138 Questions
Exam 3: Describing Data Using Numerical Measures138 Questions
Exam 4: Introduction to Probability125 Questions
Exam 5: Discrete Probability Distributions161 Questions
Exam 6: Introduction to Continuous Probability Distributions122 Questions
Exam 7: Introduction to Sampling Distributions136 Questions
Exam 8: Estimating Single Population Parameters174 Questions
Exam 9: Introduction to Hypothesis Testing183 Questions
Exam 10: Estimation and Hypothesis Testing for Two Population Parameters121 Questions
Exam 11: Hypothesis Tests and Estimation for Population Variances69 Questions
Exam 12: Analysis of Variance162 Questions
Exam 13: Goodness-Of-Fit Tests and Contingency Analysis105 Questions
Exam 14: Introduction to Linear Regression and Correlation Analysis139 Questions
Exam 15: Multiple Regression Analysis and Model Building148 Questions
Exam 16: Analyzing and Forecasting Time-Series Data131 Questions
Exam 17: Introduction to Nonparametric Statistics103 Questions
Exam 18: Introducing Business Analytics48 Questions
Exam 19: Introduction to Decision Analysis48 Questions
Exam 20: Introduction to Quality and Statistical Process Control42 Questions
Select questions type
You are given the following sample data for two variables: 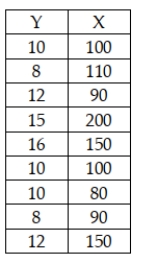 The regression model based on these sample data explains approximately 75 percent of the variation in the dependent variable.
(True/False)
4.8/5  (39)
(39)
A bank is interested in determining whether its customers' checking balances are linearly related to their savings balances. A sample of n = 20 customers was selected and the correlation was calculated to be +0.40. If the bank is interested in testing to see whether there is a significant linear relationship between the two variables using a significance level of 0.05, the value of the test statistic is approximately t = 1.8516.
(True/False)
4.8/5 (31)
Given a sample of data for use in simple linear regression, the values for the slope and the intercept are chosen to minimize the sum of squared errors.
(True/False)
4.8/5 (35)
In analyzing the residuals to determine whether the simple regression analysis satisfies the regression assumptions, which of the following is true?
(Multiple Choice)
4.8/5 (30)
A random sample of two variables, x and y, produced the following observations: 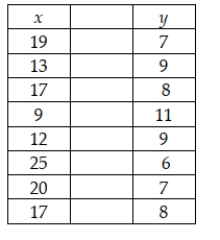 Compute the correlation coefficient for these sample data.
(Multiple Choice)
5.0/5 (40)
Assume that we have found a regression equation of = 3.6 - 2.4x, and that the coefficient of determination is 0.72, then the correlation of x and y must be about 0.849.
(True/False)
5.0/5 (33)
If the R-squared value for a regression model is high, the regression model will necessarily provide accurate forecasts of the y variable.
(True/False)
4.8/5 (37)
A study was recently performed by the Internal Revenue Service to determine how much tip income waiters and waitresses should make based on the size of the bill at each table. A random sample of bills and resulting tips were collected and the following regression results were observed: SUMMARY OUTPUT 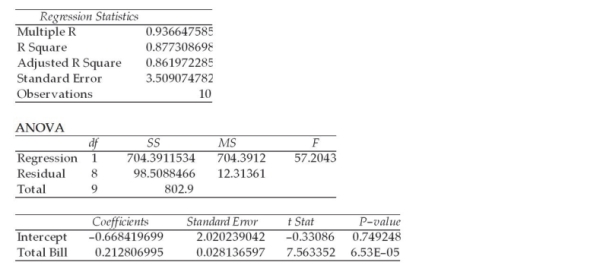 Given this output, the upper limit for the 95 percent confidence interval estimate for the true regression slope coefficient is approximately 0.28.
(True/False)
4.8/5 (38)
What factors are of importance to an analyst when linear regression analysis is used for descriptive purposes?
(Essay)
4.9/5 (31)
The following regression model has been computed based on a sample of fifty observations of part- time workers in which the individual weekly income was the dependent variable and hours worked is the independent variable : = 43.2 + 25.2x. The first observations in the sample for y and x were 350 and 15, respectively. Given this, the residual value for the first observation is approximately 71.2.
(True/False)
4.7/5 (35)
If the sample value of the intercept turns out to be an illogical value, this is acceptable as long as x = 0 is not within the range of the data.
(True/False)
4.9/5 (29)
When a pair of variables has a positive correlation, the slope in the regression equation will always be positive.
(True/False)
4.8/5 (33)
Consider the following partially completed computer printout for a regression analysis where the dependent variable is the price of a personal computer and the independent variable is the size of the hard drive. 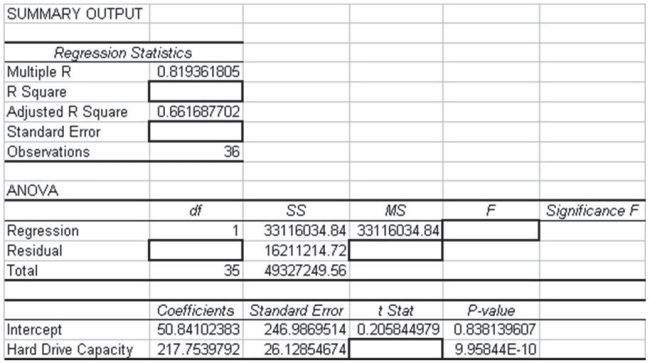 Based on the information provided, which of the following statements is true if alpha = .05?
(Multiple Choice)
4.7/5 (30)
If a simple least squares regression model is developed based on a sample where the two variables are known to be positively correlated, the sign on the regression coefficient will be positive also.
(True/False)
4.9/5 (34)
A study was recently done in which the following regression output was generated using Excel. SUMMARY OUTPUT 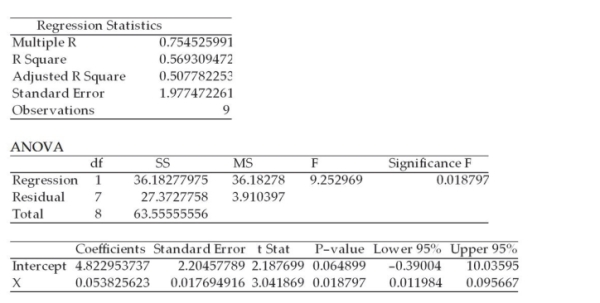 Given this output, we would reject the null hypothesis that the population regression slope coefficient is equal to zero at the alpha = 0.05 level.
(True/False)
4.9/5 (41)
In a study of 30 customers' utility bills in which the monthly bill was the dependent variable and the number of square feet in the house is the independent variable, the resulting regression model is = 23.40 + 0.4x. Based on this model, the expected utility bill for a customer with a home with 2,300 square feet is approximately $92.00.
(True/False)
4.9/5 (34)
In analyzing the relationship between two variables, a scatter plot cannot be used to detect which of the following?
(Multiple Choice)
4.8/5 (38)
Which of the following statements is true in simple linear regression?
(Multiple Choice)
4.9/5 (36)
A recent study of 15 shoppers showed that the correlation between the time spent in the store and the dollars spent was 0.235. Using a significance level equal to 0.05, which of the following is the test statistic for testing whether the true population correlation is equal to zero?
(Multiple Choice)
4.9/5 (30)
Assume that a medical research study found a correlation of -0.73 between consumption of vitamin A and the cancer rate of a particular type of cancer. This could be interpreted to mean:
(Multiple Choice)
5.0/5 (34)
Filters
- Essay(0)
- Multiple Choice(0)
- Short Answer(0)
- True False(0)
- Matching(0)