Exam 15: Multiple Regression Analysis and Model Building
Exam 1: The Where, Why, and How of Data Collection167 Questions
Exam 2: Graphs, Charts and Tablesdescribing Your Data138 Questions
Exam 3: Describing Data Using Numerical Measures138 Questions
Exam 4: Introduction to Probability125 Questions
Exam 5: Discrete Probability Distributions161 Questions
Exam 6: Introduction to Continuous Probability Distributions122 Questions
Exam 7: Introduction to Sampling Distributions136 Questions
Exam 8: Estimating Single Population Parameters174 Questions
Exam 9: Introduction to Hypothesis Testing183 Questions
Exam 10: Estimation and Hypothesis Testing for Two Population Parameters121 Questions
Exam 11: Hypothesis Tests and Estimation for Population Variances69 Questions
Exam 12: Analysis of Variance162 Questions
Exam 13: Goodness-Of-Fit Tests and Contingency Analysis105 Questions
Exam 14: Introduction to Linear Regression and Correlation Analysis139 Questions
Exam 15: Multiple Regression Analysis and Model Building148 Questions
Exam 16: Analyzing and Forecasting Time-Series Data131 Questions
Exam 17: Introduction to Nonparametric Statistics103 Questions
Exam 18: Introducing Business Analytics48 Questions
Exam 19: Introduction to Decision Analysis48 Questions
Exam 20: Introduction to Quality and Statistical Process Control42 Questions
Select questions type
The standard error of the estimate is a term that is used for the standard deviation of the residuals in a multiple regression model.
(True/False)
4.8/5  (32)
(32)
In a multiple regression model, which of the following is true?
(Multiple Choice)
4.8/5 (33)
To determine the aptness of the model, which of the following would most likely be performed?
(Multiple Choice)
4.8/5 (41)
A major car magazine has recently collected data on 30 leading cars in the U.S. market. It is interested in building a multiple regression model to explain the variation in highway miles. The following correlation matrix has been computed from the data collected: 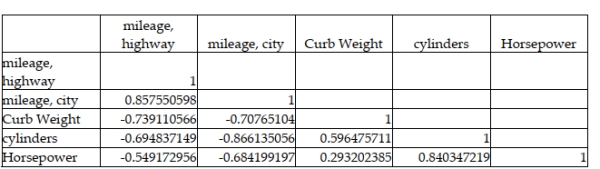 The analysts also produced the following multiple regression output using curb weight, cylinders, and horsepower as the three independent variables. Note that a number of the output fields are missing, but can be determined from the information provided.
 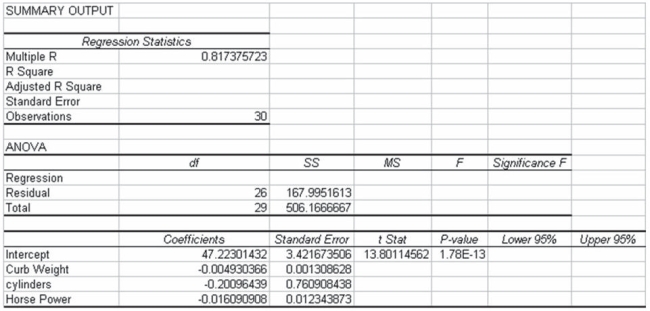 Based on the information provided, the three independent variables explain approximately 67 percent of the variation in the highway mileage among these 30 cars.
(True/False)
4.9/5 (26)
If one or more of the regression assumptions has been violated this means that the current regression model is not the best one for this data set, and another model should be sought.
(True/False)
4.7/5 (36)
A decision maker has five potential independent variables with which to build a regression model to explain the variation in the dependent variable. At step 1, variable x3 enters the regression model. Which of the following indicates which of the four remaining independent variables will be next to enter the model?
(Multiple Choice)
4.9/5 (30)
A major car magazine has recently collected data on 30 leading cars in the U.S. market. It is interested in building a multiple regression model to explain the variation in highway miles. The following correlation matrix has been computed from the data collected:  If only one independent variable (ignoring city mileage) is to be used in explaining the dependent variable in a regression model, the percentage of variation that will be explained will be nearly 74 percent.
(True/False)
4.8/5 (31)
In a forward stepwise regression process, it is actually possible for the R-square value to decline if variables are added to the regression model that do not help to explain the variation in the dependent variable.
(True/False)
4.9/5 (32)
In the model diagnosis step in regression modeling, we are interested in whether the overall regression model and individual variables are significant in addition to satisfying regression analysis assumptions.
(True/False)
4.8/5 (37)
In conducting multiple regression analysis, t-tests are one way to test for significance between x and y variables prior to conducting the F-test.
(True/False)
4.8/5 (38)
The editors of a national automotive magazine recently studied 30 different automobiles sold in the United States with the intent of seeing whether they could develop a multiple regression model to explain the variation in highway miles per gallon. A number of different independent variables were collected. The following regression output (with some values missing) was recently presented to the editors by the magazine's analysts:  Based on this output and your understanding of multiple regression analysis, which of the following statements is true?
(Multiple Choice)
4.7/5 (30)
A major car magazine has recently collected data on 30 leading cars in the U.S. market. It is interested in building a multiple regression model to explain the variation in highway miles. The following correltion matrix has been computed from the data collected: 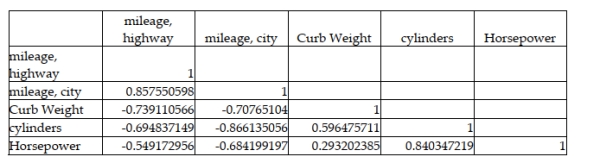 The analysts also produced the following multiple regression output using curb weight, cylinders, and horsepower as the three independent variables. Note, a number of the output fields are missing, but can be determined from the information provided.
 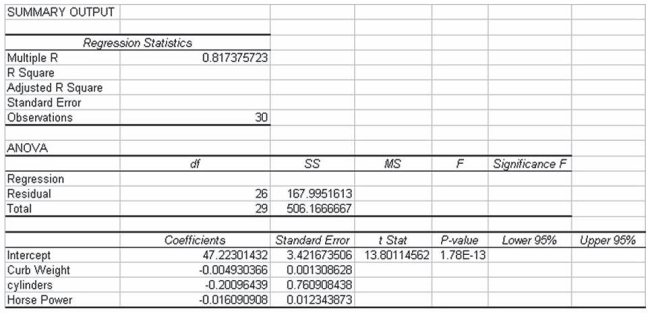 Based on the information provided, holding the other variables constant, increasing horsepower by one unit results in an average decrease in highway mileage by 0.016 miles per gallon.
(True/False)
4.8/5 (23)
It is possible for the standard error of the estimate to actually increase if variables are added to the model that do not aid in explaining the variation in the dependent variable.
(True/False)
4.7/5 (38)
The following output is for a second-order polynomial regression model where the independent variables are x and x2 (x^2 in output). Some of the output has been omitted. 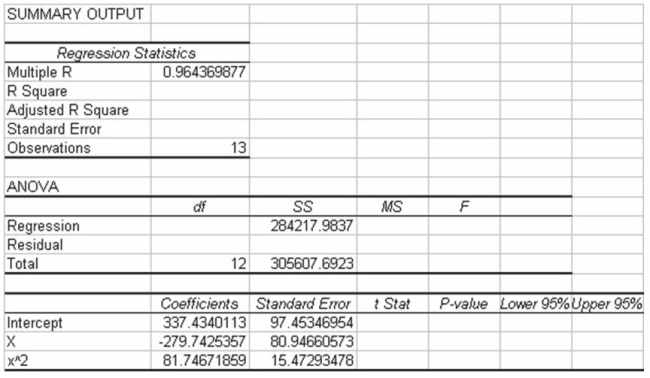 Considering the above information, the model explains approximately 56.7 percent of the variation in the y variable.
(True/False)
4.9/5 (27)
A study has recently been conducted by a major computer magazine publisher in which the objective was to develop a multiple regression model to explain the variation in price of personal computers. Three independent variables were used. The following computer printout shows the final output. However, several values are omitted from the printout. 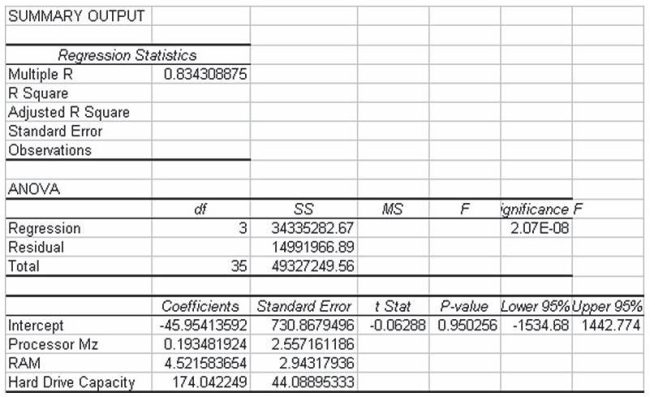 Given this information, using an alpha = .05 level, you can conclude that the overall regression model is statistically significant.
(True/False)
4.8/5 (30)
In curvilinear regression modeling, a composite model is one that contains either the basic terms or the interactive terms but not both.
(True/False)
4.9/5 (36)
In a multiple regression model, R-square can be computed by squaring the highest correlation coefficient between the dependent variable and any independent variable.
(True/False)
4.9/5 (38)
You should not include more than one categorical variable in a multiple regression because the use of two or more will cause misleading results.
(True/False)
4.9/5 (38)
Filters
- Essay(0)
- Multiple Choice(0)
- Short Answer(0)
- True False(0)
- Matching(0)