Exam 15: Multiple Regression Analysis and Model Building
Exam 1: The Where, Why, and How of Data Collection167 Questions
Exam 2: Graphs, Charts and Tablesdescribing Your Data138 Questions
Exam 3: Describing Data Using Numerical Measures138 Questions
Exam 4: Introduction to Probability125 Questions
Exam 5: Discrete Probability Distributions161 Questions
Exam 6: Introduction to Continuous Probability Distributions122 Questions
Exam 7: Introduction to Sampling Distributions136 Questions
Exam 8: Estimating Single Population Parameters174 Questions
Exam 9: Introduction to Hypothesis Testing183 Questions
Exam 10: Estimation and Hypothesis Testing for Two Population Parameters121 Questions
Exam 11: Hypothesis Tests and Estimation for Population Variances69 Questions
Exam 12: Analysis of Variance162 Questions
Exam 13: Goodness-Of-Fit Tests and Contingency Analysis105 Questions
Exam 14: Introduction to Linear Regression and Correlation Analysis139 Questions
Exam 15: Multiple Regression Analysis and Model Building148 Questions
Exam 16: Analyzing and Forecasting Time-Series Data131 Questions
Exam 17: Introduction to Nonparametric Statistics103 Questions
Exam 18: Introducing Business Analytics48 Questions
Exam 19: Introduction to Decision Analysis48 Questions
Exam 20: Introduction to Quality and Statistical Process Control42 Questions
Select questions type
A major car magazine has recently collected data on 30 leading cars in the U.S. market. It is interested in building a multiple regression model to explain the variation in highway miles. The following correlation matrix has been computed from the data collected: 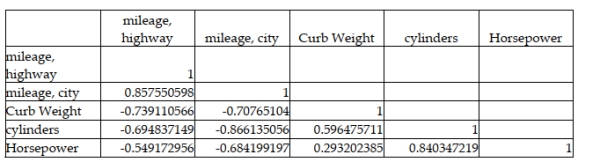 The analysts also produced the following multiple regression output using curb weight, cylinders, and horsepower as the three independent variables. Note, a number of the output fields are missing, but can be determined from the information provided.
 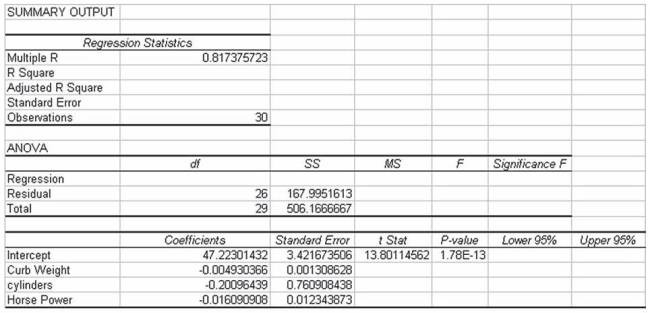 Based on this information, the standard error of the estimate for the regression model is approximately 6.46 miles per gallon.
(True/False)
4.8/5  (33)
(33)
In a multiple regression analysis involving 15 independent variables and 200 observations, SST = 800 and SSE = 240. The adjusted coefficient of determination is
(Multiple Choice)
4.7/5 (32)
The editors of a national automotive magazine recently studied 30 different automobiles sold in the United States with the intent of seeing whether they could develop a multiple regression model to explain the variation in highway miles per gallon. A number of different independent variables were collected. The following regression output (with some values missing) was recently presented to the editors by the magazine's analysts: 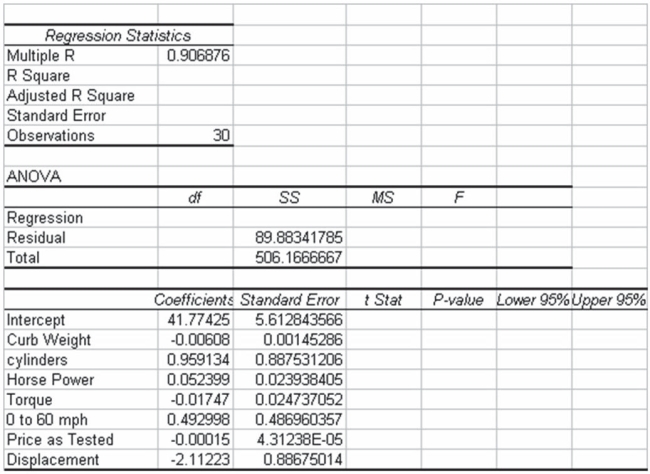 Based on this output and your understanding of multiple regression analysis, what is the value of the standard error of the estimate for this model?
(Multiple Choice)
4.8/5 (32)
The variance inflation factor is an indication of how much multicollinearity there is in the regression model.
(True/False)
4.9/5 (39)
Which of the following is not an indication of potential multicollinearity problems?
(Multiple Choice)
4.8/5 (35)
In a multiple regression model where three independent variables are included in the model, the percentage of explained variation will be equal to the square of the sum of the correlations between the independent variables and the dependent variable.
(True/False)
4.9/5 (38)
The assumption that the errors or residuals are independent is best checked by:
(Multiple Choice)
4.7/5 (30)
A regression equation that predicts the price of homes in thousands of dollars is t = 24.6 + 0.055x1 - 3.6x2, where x2 is a dummy variable that represents whether the house in on a busy street or not. Here x2 = 1 means the house is on a busy street and x2 = 0 means it is not. Based on this information, which of the following statements is true?
(Multiple Choice)
4.9/5 (35)
The editors of a national automotive magazine recently studied 30 different automobiles sold in the United States with the intent of seeing whether they could develop a multiple regression model to explain the variation in highway miles per gallon. A number of different independent variables were collected. The following regression output (with some values missing) was recently presented to the editors by the magazine's analysts:  Based on this output and your understanding of multiple regression analysis, which of the independent variables is not considered statistically significant if the test is conducted at the 0.05 level of statistical significance?
(Multiple Choice)
4.8/5 (31)
The following multiple regression was conducted to attempt to predict the price of yachts based on the independent variables shown. 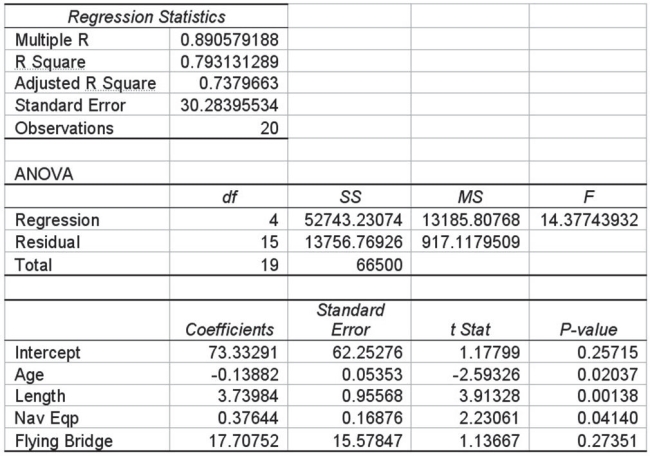 Given this information and your knowledge of multiple regression, determine which, if any, of the four independent variables are statistically significant in explaining the variation in the dependent variable. Use a 0.05 level of significance and use the p-value method.
(Essay)
4.9/5 (31)
A decision maker is considering including two additional variables into a regression model that has as the dependent variable, Total Sales. The first additional variable is the region of the country (North, South, East, or West) in which the company is located. The second variable is the type of business (Manufacturing, Financial, Information Services, or Other). Given this, how many additional variables will be incorporated into the model?
(Multiple Choice)
4.9/5 (38)
In a forward selection stepwise regression process, the first variable to be selected will be the variable that can, by itself, do the most to explain the variation in the dependent variable. This will be the variable that provided the highest possible R-square value by itself.
(True/False)
4.7/5 (25)
On a survey there is a question that asks whether someone lives in a house, apartment, or condominium. These three responses could be coded in a dummy variable using value 0, 1, and 2.
(True/False)
4.8/5 (28)
The multiple coefficient of determination measures the percentage of variation in the dependent variable that is explained by the independent variables in the model.
(True/False)
4.8/5 (36)
In a forward selection stepwise regression process, the second variable to be selected from the list of potential independent variables is always the one that has the second highest correlation with the dependent variable.
(True/False)
4.8/5 (43)
A study has recently been conducted by a major computer magazine publisher in which the objective was to develop a multiple regression model to explain the variation in price of personal computers. Three independent variables were used. The following computer printout shows the final output. However, several values are omitted from the printout. 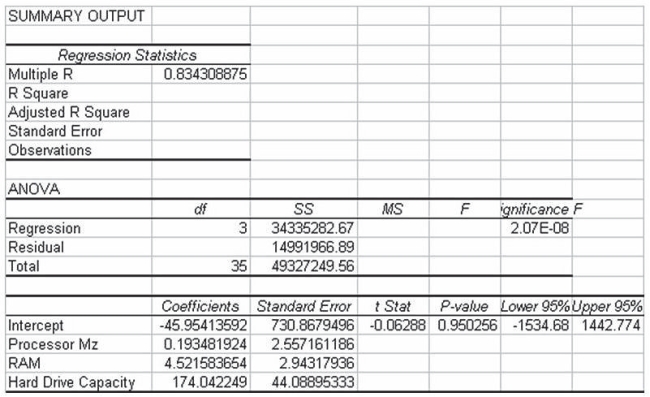 Given this information, the regression model explains just under 70 percent of the variation in the price of personal computers.
(True/False)
4.8/5 (29)
Where there are two independent variables in a multiple regression, the regression equation forms a plane.
(True/False)
4.9/5 (34)
A multiple regression was conducted to predict the price of yachts in thousands of dollars. A dummy variable was included to indicate whether or not the yacht has a flying bridge, where 0 means "no" and 1 means "yes." 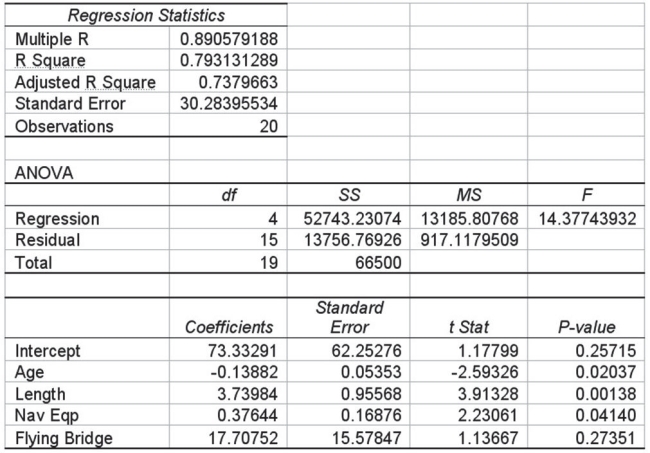 Which of the following statements is correct using the 0.10 level of significance?
(Multiple Choice)
4.7/5 (32)
If given a choice in collecting data on age for use as an independent variable in a regression model, a decision maker would generally prefer to record the actual age rather than an age category so as to avoid using dummy variables.
(True/False)
4.8/5 (40)
Stepwise regression is the approach that is always taken when developing a regression model to fit a curvilinear relationship between the dependent and potential independent variables.
(True/False)
4.9/5 (25)
Filters
- Essay(0)
- Multiple Choice(0)
- Short Answer(0)
- True False(0)
- Matching(0)