Exam 15: Multiple Regression Analysis and Model Building
Exam 1: The Where, Why, and How of Data Collection167 Questions
Exam 2: Graphs, Charts and Tablesdescribing Your Data138 Questions
Exam 3: Describing Data Using Numerical Measures138 Questions
Exam 4: Introduction to Probability125 Questions
Exam 5: Discrete Probability Distributions161 Questions
Exam 6: Introduction to Continuous Probability Distributions122 Questions
Exam 7: Introduction to Sampling Distributions136 Questions
Exam 8: Estimating Single Population Parameters174 Questions
Exam 9: Introduction to Hypothesis Testing183 Questions
Exam 10: Estimation and Hypothesis Testing for Two Population Parameters121 Questions
Exam 11: Hypothesis Tests and Estimation for Population Variances69 Questions
Exam 12: Analysis of Variance162 Questions
Exam 13: Goodness-Of-Fit Tests and Contingency Analysis105 Questions
Exam 14: Introduction to Linear Regression and Correlation Analysis139 Questions
Exam 15: Multiple Regression Analysis and Model Building148 Questions
Exam 16: Analyzing and Forecasting Time-Series Data131 Questions
Exam 17: Introduction to Nonparametric Statistics103 Questions
Exam 18: Introducing Business Analytics48 Questions
Exam 19: Introduction to Decision Analysis48 Questions
Exam 20: Introduction to Quality and Statistical Process Control42 Questions
Select questions type
Assume that a time-series plot takes the form of that shown in the following graph: 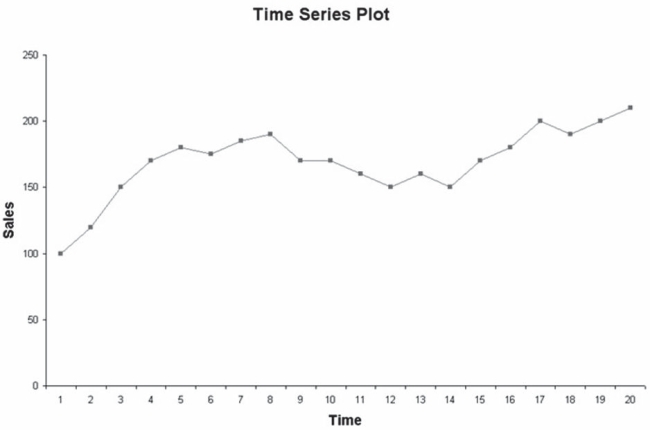 Given this plot, which of the following models would likely give the best fit?
(Multiple Choice)
4.8/5  (40)
(40)
The following residual plot was constructed based on a simple linear regression model. 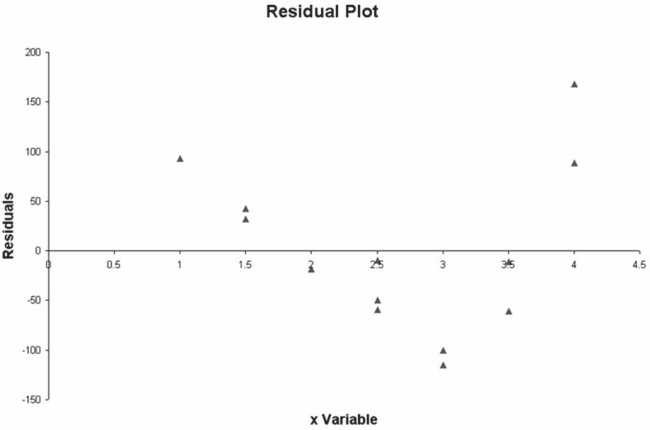 Based on this plot, there appears to be no basis for concluding that a curvilinear model may be more appropriate than a linear model to explain the variation in the y variable.
(True/False)
4.8/5 (35)
Standard stepwise regression combines attributes of both forward selection and backward elimination.
(True/False)
5.0/5 (36)
A multiple regression is shown for a data set of yachts where the dependent variable is the price in thousands of dollars. 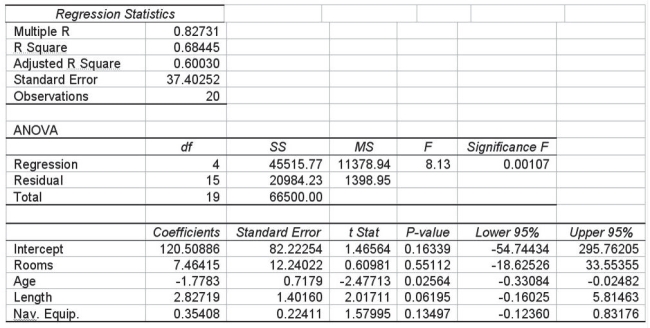 Given this information, which is correct regarding the test of the overall model using the 0.10 level of significance?
(Multiple Choice)
4.8/5 (39)
A multiple regression is shown for a data set of yachts where the dependent variable is the price in thousands of dollars.  Given this information, what is the null hypothesis for testing the overall model?
(Multiple Choice)
4.9/5 (32)
Which of the following would best describe the situation that a second-degree polynomial regression equation would be used to model?
(Multiple Choice)
4.9/5 (42)
When the best subsets approach is used in a regression application, one method for determining which of the many possible models to select for potential use is called the Cp statistic.
(True/False)
4.8/5 (24)
In multiple regression analysis, the residual is the absolute difference between the actual value of y and the predicted value of y.
(True/False)
4.8/5 (30)
Filters
- Essay(0)
- Multiple Choice(0)
- Short Answer(0)
- True False(0)
- Matching(0)