Exam 15: Multiple Regression Analysis and Model Building
Exam 1: The Where, Why, and How of Data Collection167 Questions
Exam 2: Graphs, Charts and Tablesdescribing Your Data138 Questions
Exam 3: Describing Data Using Numerical Measures138 Questions
Exam 4: Introduction to Probability125 Questions
Exam 5: Discrete Probability Distributions161 Questions
Exam 6: Introduction to Continuous Probability Distributions122 Questions
Exam 7: Introduction to Sampling Distributions136 Questions
Exam 8: Estimating Single Population Parameters174 Questions
Exam 9: Introduction to Hypothesis Testing183 Questions
Exam 10: Estimation and Hypothesis Testing for Two Population Parameters121 Questions
Exam 11: Hypothesis Tests and Estimation for Population Variances69 Questions
Exam 12: Analysis of Variance162 Questions
Exam 13: Goodness-Of-Fit Tests and Contingency Analysis105 Questions
Exam 14: Introduction to Linear Regression and Correlation Analysis139 Questions
Exam 15: Multiple Regression Analysis and Model Building148 Questions
Exam 16: Analyzing and Forecasting Time-Series Data131 Questions
Exam 17: Introduction to Nonparametric Statistics103 Questions
Exam 18: Introducing Business Analytics48 Questions
Exam 19: Introduction to Decision Analysis48 Questions
Exam 20: Introduction to Quality and Statistical Process Control42 Questions
Select questions type
To check out whether the regression assumption involving normality of the error terms is valid, it is appropriate to construct a normal probability plot. If this plot forms a straight line from the lower left- hand corner diagonally up to the upper right-hand corner, the error terms may be assumed to be normally distributed.
(True/False)
4.8/5  (40)
(40)
To describe variable credit status that has three levels: Excellent, Good, and Poor, we need to use two different dummy variables.
(True/False)
4.7/5 (39)
The editors of a national automotive magazine recently studied 30 different automobiles sold in the United States with the intent of seeing whether they could develop a multiple regression model to explain the variation in highway miles per gallon. A number of different independent variables were collected. The following regression output (with some values missing) was recently presented to the editors by the magazine's analysts:  Based on this output and your understanding of multiple regression analysis, what percentage of variation in the dependent variable is explained by the regression model?
(Multiple Choice)
4.8/5 (27)
A major car magazine has recently collected data on 30 leading cars in the U.S. market. It is interested in building a multiple regression model to explain the variation in highway miles. The following correlation matrix has been computed from the data collected: 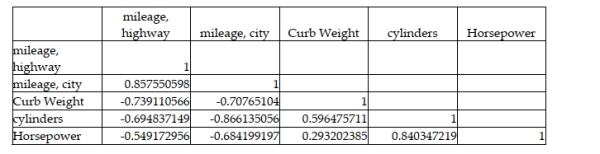 The analysts also produced the following multiple regression output using curb weight, cylinders, and horsepower as the three independent variables. Note, a number of the output fields are missing, but can be determined from the information provided.
 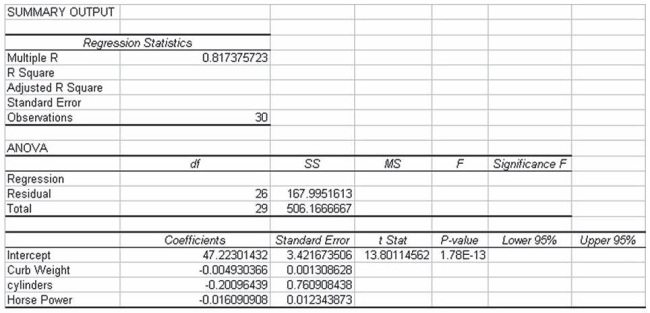 If the analysts are interested in testing whether the overall regression model is statistically significant, the appropriate null and alternative hypotheses are: H0 : β1 = β2 = β3 Ha : β1 ≠ β2 ≠ β3
(True/False)
4.9/5 (39)
A multiple regression model of the form = B0 + B1x + B2x2 + B3x3 + ε is called an expanded second- order polynomial since it contains all the terms up to x3 in the model at one time.
(True/False)
4.9/5 (37)
In a second-order polynomial regression model, the regression coefficient, B2, will be positive if the parabola opens downward and negative when the parabola opens upward.
(True/False)
4.7/5 (32)
In a multiple regression model, it is assumed that the errors or residuals are normally distributed.
(True/False)
4.9/5 (28)
Standard stepwise regression is a good way of identifying potential multicollinearity problems since we are able to see the impact on the model at each step that occurs when a new variable is added to the model. For instance, if bringing in a new variable causes the sign to change on a previously entered variable, we have evidence of multicollinearity.
(True/False)
4.8/5 (26)
One reason for examining the adjusted R-square value in a multiple regression analysis is that the R- square value will increase just by adding additional independent variables to the model, whereas the adjusted R-square accounts for the relationship between the number of independent variables and the sample size and may actually decline if inappropriate independent variables are included in the model.
(True/False)
4.9/5 (38)
Which of the following is an advantage of using stepwise regression compared to just entering all the independent variables at one time?
(Multiple Choice)
4.9/5 (38)
A complete polynomial model contains terms of all orders less than or equal to the pth order.
(True/False)
4.9/5 (39)
A major car magazine has recently collected data on 30 leading cars in the U.S. market. It is interested in building a multiple regression model to explain the variation in highway miles. The following correlation matrix has been computed from the data collected: 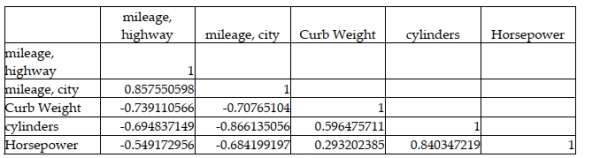 The analysts also produced the following multiple regression output using curb weight, cylinders, and horsepower as the three independent variables. Note, a number of the output fields are missing, but can be determined from the information provided.
  Based on the above information, the test statistic for testing whether the overall model is statistically significant is approximately F = 17.4
(True/False)
4.9/5 (34)
Which of the following is not an assumption of the multiple regression model?
(Multiple Choice)
4.8/5 (32)
A study has recently been conducted by a major computer magazine publisher in which the objective was to develop a multiple regression model to explain the variation in price of personal computers. Three quantitative independent variables were used along with one qualitative variable. The qualitative variable was coded 1 if the computer included a monitor, 0 otherwise. The following computer printout shows the final output. 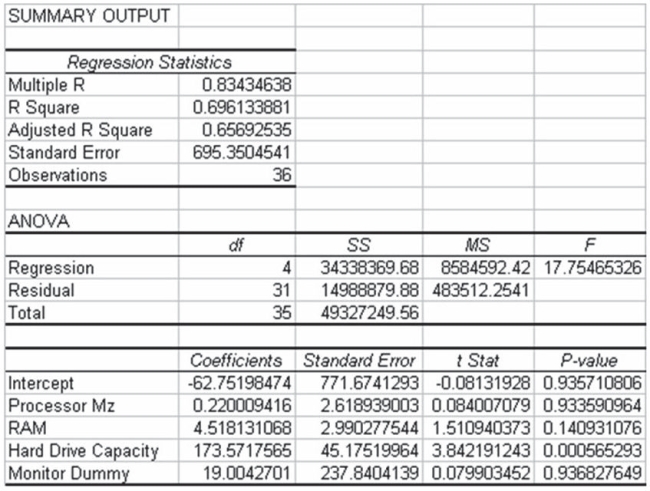 Based on this information, and with a 0.05 level of significance, which of the following conclusions can be justified?
(Multiple Choice)
4.9/5 (49)
In regression model: 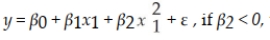 then the value of y is expected to increase with x until x reaches a certain point after which the value of y is expected to decrease.
(True/False)
4.9/5 (31)
A study has recently been conducted by a major computer magazine publisher in which the objective was to develop a multiple regression model to explain the variation in price of personal computers. Three independent variables were used. The following computer printout shows the final output. However, several values are omitted from the printout. 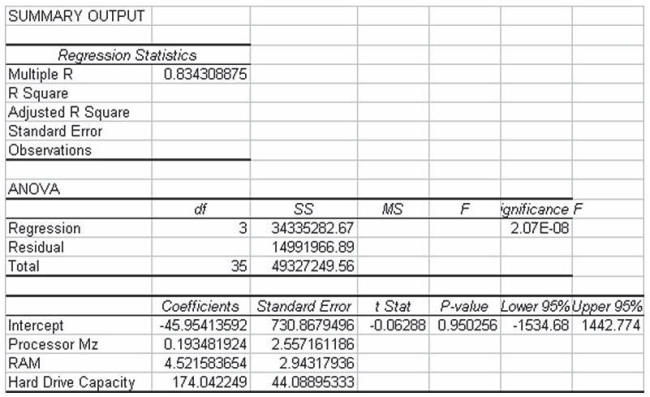 Given this information, the calculated test statistic for the regression slope coefficient on the variable RAM, is approximately 1.54.
(True/False)
4.8/5 (42)
In a multiple regression, the dependent variable is house value (in '000$) and one of the independent variables is a dummy variable, which is defined as 1 if a house has a garage and 0 if not. The coefficient of the dummy variable is found to be 5.4 but the t-test reveals that it is not significant at the 0.05 level. Which of the following is true?
(Multiple Choice)
4.9/5 (35)
Filters
- Essay(0)
- Multiple Choice(0)
- Short Answer(0)
- True False(0)
- Matching(0)