Exam 15: Multiple Regression Analysis and Model Building
Exam 1: The Where, Why, and How of Data Collection167 Questions
Exam 2: Graphs, Charts and Tablesdescribing Your Data138 Questions
Exam 3: Describing Data Using Numerical Measures138 Questions
Exam 4: Introduction to Probability125 Questions
Exam 5: Discrete Probability Distributions161 Questions
Exam 6: Introduction to Continuous Probability Distributions122 Questions
Exam 7: Introduction to Sampling Distributions136 Questions
Exam 8: Estimating Single Population Parameters174 Questions
Exam 9: Introduction to Hypothesis Testing183 Questions
Exam 10: Estimation and Hypothesis Testing for Two Population Parameters121 Questions
Exam 11: Hypothesis Tests and Estimation for Population Variances69 Questions
Exam 12: Analysis of Variance162 Questions
Exam 13: Goodness-Of-Fit Tests and Contingency Analysis105 Questions
Exam 14: Introduction to Linear Regression and Correlation Analysis139 Questions
Exam 15: Multiple Regression Analysis and Model Building148 Questions
Exam 16: Analyzing and Forecasting Time-Series Data131 Questions
Exam 17: Introduction to Nonparametric Statistics103 Questions
Exam 18: Introducing Business Analytics48 Questions
Exam 19: Introduction to Decision Analysis48 Questions
Exam 20: Introduction to Quality and Statistical Process Control42 Questions
Select questions type
The editors of a national automotive magazine recently studied 30 different automobiles sold in the United States with the intent of seeing whether they could develop a multiple regression model to explain the variation in highway miles per gallon. A number of different independent variables were collected. The following regression output is the result of using a forward selection stepwise regression approach.  Which of the following might explain why no other independent variables entered the model?
(Multiple Choice)
5.0/5  (34)
(34)
A multiple regression is shown for a data set of yachts where the dependent variable is the price in thousands of dollars. 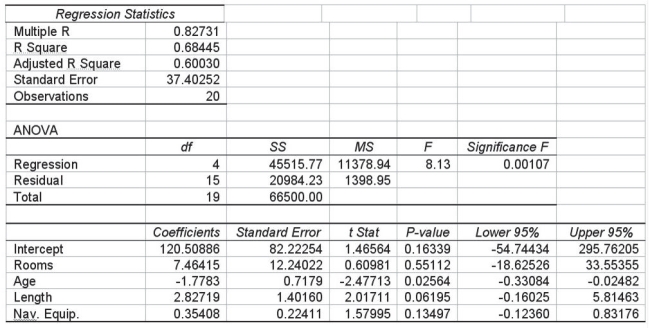 Based on this output, which of the independent variables appear to be significantly helping to predict the price of a yacht, using a 0.10 level of significance?
(Multiple Choice)
4.9/5 (44)
A regression equation that predicts the price of homes in thousands of dollars is yˆ = 24.6 + 0.055x1 - 3.6x2, where x2 is a dummy variable that represents whether the house is on a busy street or not. Here x2 = 1 means the house is on a busy street and x2 = 0 means it is not. From this we can conclude that on average homes that are on busy streets are worth $3600 more than homes that are not on busy streets.
(True/False)
4.7/5 (31)
In a multiple regression model, the regression coefficients are calculated such that the quantity, , is minimized.
(True/False)
4.9/5 (33)
The variance inflation factor (VIF) provides a measure for each independent variable of how much multicollinearity is associated with that particular independent variable.
(True/False)
4.8/5 (33)
In simple linear regression analysis, the regression model forms a straight line in two-dimensional space through the x,y data points, while a multiple regression model forms a plane through multidimensional space.
(True/False)
4.9/5 (38)
The following multiple regression output was generated from a study in which two independent variables are included. The first independent variable (X1) is a quantitative variable measured on a continuous scale. The second variable (X2) is qualitative coded 0 if Yes, 1 if No. 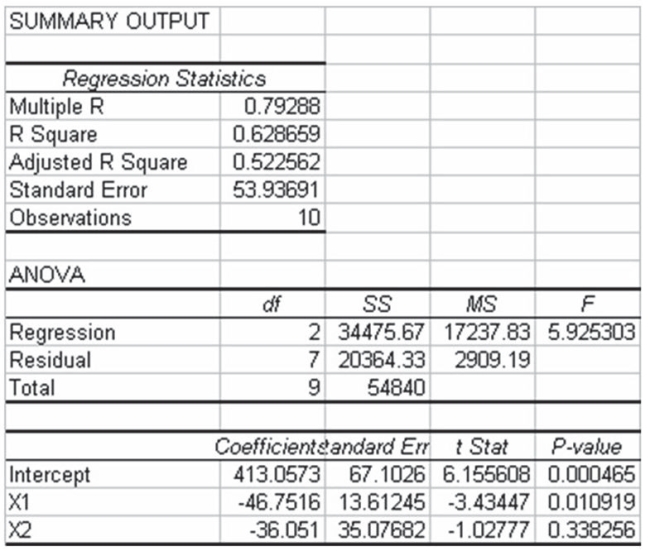 Based on this information, which of the following statements is true?
(Multiple Choice)
4.9/5 (42)
When an independent variable, that has a positive correlation with the dependent variable, receives a negative slope in a multiple regression, this is probably caused by multicollinearity.
(True/False)
4.8/5 (32)
When a regression equation includes a term such as x1x2 where two independent variables are multiplied, this is an interaction term.
(True/False)
4.7/5 (30)
Consider the following regression equation: = 356 + 180x1 - 2.5x2. The x1 variable is a quantitative variable and the x2 variable is a dummy with values 1 and 0. Given this, we can interpret the slope coefficient on variable x2 as follows: Holding x1 constant, if the value of x2 is changed from 0 to 1, the average value of y will decrease by 2.5 units.
(True/False)
4.7/5 (38)
A major car magazine has recently collected data on 30 leading cars in the U.S. market. It is interested in building a multiple regression model to explain the variation in highway miles. The following correlation matrix has been computed from the data collected: 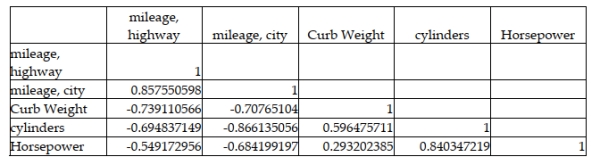 The analysts also produced the following multiple regression output using curb weight, cylinders, and horsepower as the three independent variables. Note, a number of the output fields are missing, but can be determined from the information provided.
 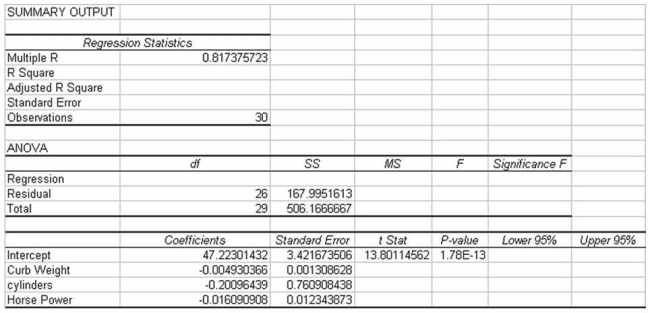 Based on the information provided, using a 0.05 level of statistical significance, both curb weight and horsepower are statistically significant variables in explaining the variation in the dependent variable when they are included in the model along with cylinders.
(True/False)
4.9/5 (33)
A multiple regression is shown below for a data set of yachts where the dependent variable is the price of the boat in thousands of dollars.  Given this information, what percentage of variation in the dependent variable is explained by the regression model?
(Multiple Choice)
4.9/5 (36)
The editors of a national automotive magazine recently studied 30 different automobiles sold in the United States with the intent of seeing whether they could develop a multiple regression model to explain the variation in highway miles per gallon. A number of different independent variables were collected. Included in these were two variables described as follows: 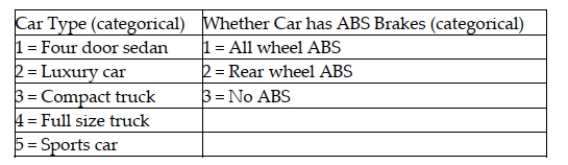 If these two variables are to be included in a regression model, how many additional variables will be needed?
(Multiple Choice)
4.8/5 (38)
The editors of a national automotive magazine recently studied 30 different automobiles sold in the United States with the intent of seeing whether they could develop a multiple regression model to explain the variation in highway miles per gallon. A number of different independent variables were collected. The following regression output is the result of using a forward selection stepwise regression approach. 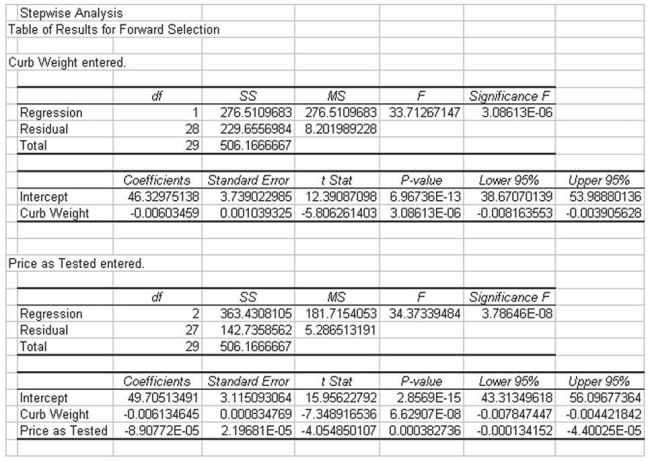 Based on the regression output, which of the following statements is true?
(Multiple Choice)
4.9/5 (25)
The editors of a national automotive magazine recently studied 30 different automobiles sold in the United States with the intent of seeing whether they could develop a multiple regression model to explain the variation in highway miles per gallon. A number of different independent variables were collected. The following regression output (with some values missing) was recently presented to the editors by the magazine's analysts:  Based on this output and your understanding of multiple regression analysis, how many degrees of freedom are associated with the Residual in the ANOVA table?
(Multiple Choice)
4.9/5 (33)
The following residual plot is an output of a regression model. 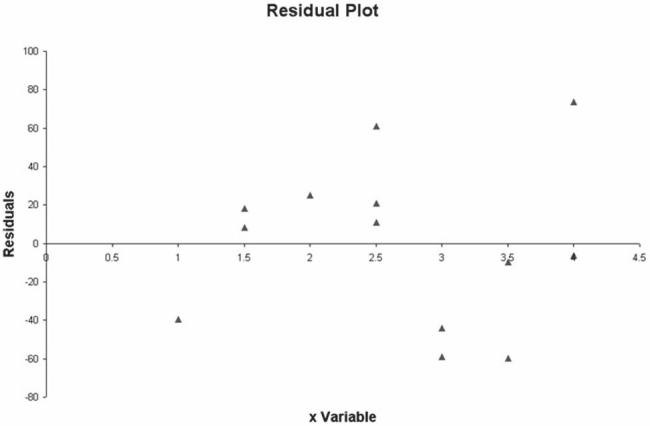 Based on this residual plot, there is evidence to suggest that the underlying relationship between the y variable and the x variable is nonlinear.
(True/False)
4.8/5 (31)
It is generally suggested that the sample size in developing a multiple regression model should be at least four times the number of independent variables.
(True/False)
4.8/5 (36)
The correlation matrix is an effective means of determining whether any of the independent variables has a curvilinear relationship with the dependent variable.
(True/False)
4.8/5 (26)
The editors of a national automotive magazine recently studied 30 different automobiles sold in the United States with the intent of seeing whether they could develop a multiple regression model to explain the variation in highway miles per gallon. A number of different independent variables were collected. The following regression output (with some values missing) was recently presented to the editors by the magazine's analysts: 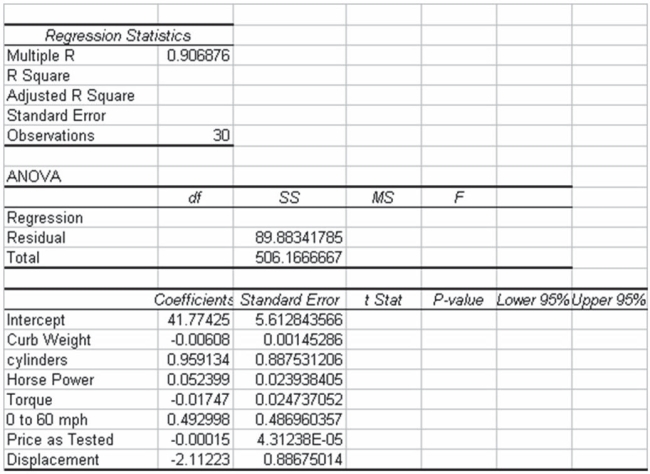 Based on this output and your understanding of multiple regression analysis, what is the adjusted R- square value for this model?
(Multiple Choice)
4.7/5 (36)
Filters
- Essay(0)
- Multiple Choice(0)
- Short Answer(0)
- True False(0)
- Matching(0)