Exam 2: Exploring Data With Tables and Graphs
Exam 1: Introduction to Statistics155 Questions
Exam 2: Exploring Data With Tables and Graphs132 Questions
Exam 3: Describing, Exploring, and Comparing Data225 Questions
Exam 4: Probability219 Questions
Exam 5: Discrete Probability Distributions205 Questions
Exam 6: Normal Probability Distributions254 Questions
Exam 7: Estimating Parameters and Determining Sample Sizes170 Questions
Exam 8: Hypothesis Testing187 Questions
Exam 9: Inferences From Two Samples192 Questions
Exam 10: Correlation and Regression174 Questions
Exam 11: Goodness-Of-Fit and Contingency Tables100 Questions
Exam 12: Analysis of Variance113 Questions
Exam 13: Nonparametric Tests121 Questions
Exam 14: Statistical Process Control90 Questions
Select questions type
Solve the problem.
-The Kappa Iota Sigma Fraternity polled its members on the weekend party theme. The vote was as follows: six for toga, four for hayride, eight for beer bash, and two for masquerade. Display the vote count in a Pareto chart. 
(Multiple Choice)
4.8/5  (37)
(37)
The histogram below represents the number of television sets per household for a sample of U.S. households. What is the maximum number of households having the same number of television sets? 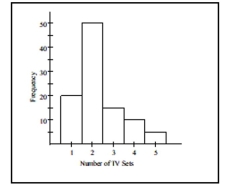
(Multiple Choice)
4.8/5 (35)
The following frequency distribution analyzes the scores on a math test. Find the class midpoint of scores interval 95-99. Scores Number of students 40-59 2 60-75 4 76-82 6 83-94 15 95-99 5
(Multiple Choice)
4.8/5 (44)
The following frequency distribution analyzes the scores on a math test. Find the class boundaries of scores interval 40-59. Scores Number of students 40-59 2 60-75 4 76-82 6 83-94 15 95-99 5
(Multiple Choice)
4.9/5 (38)
The histogram below represents the number of television sets per household for a sample of U.S. households. What is the sample size? 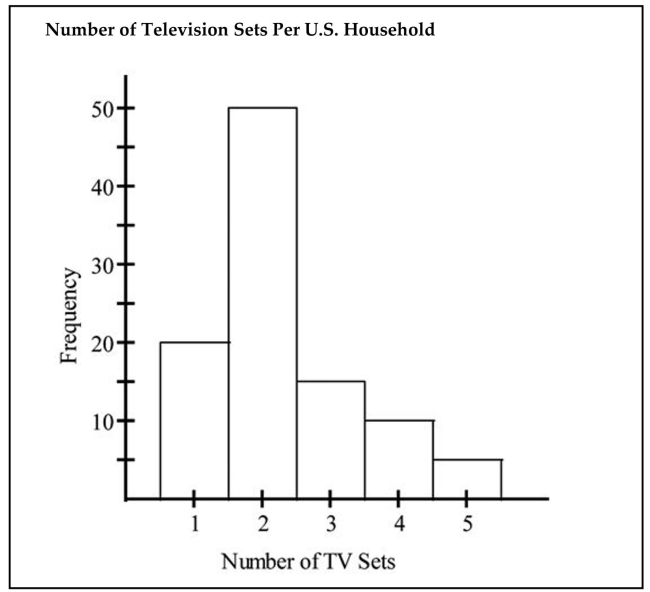
(Multiple Choice)
4.7/5 (38)
The ages of the 45 members of a track and field team are listed below. Which of these choices display the correct stemplot? 21 18 42 35 32 21 44 25 38 48 14 19 23 22 28 32 34 27 31 17 16 41 37 22 24 33 32 21 26 30 22 27 32 30 20 18 17 21 15 26 36 31 40 16 25
(Multiple Choice)
4.8/5 (31)
The following data set represents Heather's average monthly charges (in $) for cable TV for the past 12 months. 105 125 110 98 102 115 110 123 118 101 95 128 Construct a frequency distribution with 4 classes. Charges \ Frequency
(Essay)
4.8/5 (40)
A nurse measured the blood pressure of each person who visited her clinic. Following is a relative-frequency histogram for the systolic blood pressure readings for those people aged between 25 and 40. The blood pressure
Readings were given to the nearest whole number. What class width was used to construct the relative
Frequency distribution? 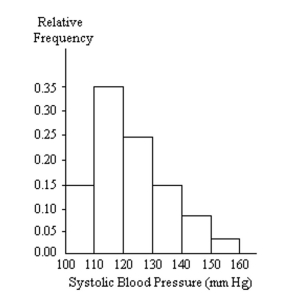
(Multiple Choice)
4.8/5 (36)
The following frequency distribution analyzes the scores on a math test. Find the class boundaries of scores interval 95-99. Scores Number of students 40-59 2 60-75 4 76-82 6 83-94 15 95-99 5
(Multiple Choice)
5.0/5 (42)
Use the data to create a stemplot.
-The following data show the number of laps run by each participant in a marathon. 46 65 55 43 51 48 57 30 43 49 32 56
(Multiple Choice)
4.9/5 (34)
The frequency distribution below summarizes the home sale prices in the city of Summerhill for the month of
June. Determine the class width, class midpoint, and the class boundaries for the class 235.0-265.9.
(Essay)
4.8/5 (44)
Using a strict interpretation of the relevant criteria characterizing a normal distribution,does the frequency
distribution below appear to have a normal distribution? Does the distribution appear to be normal if the
criteria are interpreted very loosely? Closing Share Price Frequency 0-5 2 6-10 5 11-15 15 16-20 27
(Essay)
4.8/5 (39)
Explain in your own words why a bar graph can be misleading if one or both of the scales begin at some value
other than zero.
(Essay)
4.8/5 (33)
The weights (in pounds) of 22 members of the junior varsity football team are listed below. 144 152 142 151 160 152 131 164 141 153 140 144 175 156 147 133 172 159 135 159 148 171
Which of these choices display the correct stemplot?
(Multiple Choice)
4.8/5 (34)
A nurse measured the blood pressure of each person who visited her clinic. Following is a relative-frequency histogram for the systolic blood pressure readings for those people aged between 25 and 40 years. The blood
Pressure readings were given to the nearest whole number. Approximately what percentage of the people aged
25-40 had a systolic blood pressure reading between 110 and 119 mm Hg inclusive?
Systolic Blood Pressure for People Aged 25-40 Years 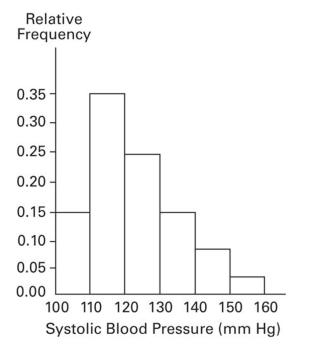
(Multiple Choice)
4.8/5 (40)
A school district performed a study to find the main causes leading to its students dropping out of school.
Thirty cases were analyzed, and a primary cause was assigned to each case. The causes included unexcused
absences (U), illness (I), family problems (F), and other causes (O). The results for the thirty cases are listed
below: Construct a table summarizing the frequency distribution of the primary causes leading to student dropout. Cause Frequency
(Essay)
4.8/5 (38)
A store manager counts the number of customers who make a purchase in his store each day. The data are as follows.
10 11 8 14 7 10 10 11 8 7
(Multiple Choice)
4.7/5 (27)
The following data represent the number of cars passing through a toll booth during a certain time period over a number of days.
 38 39 37 37 44 38 41 38 39 35 42 39 43 37 41
(Multiple Choice)
4.7/5 (42)
A manufacturer records the number of errors each work station makes during the week. The data are as follows. 6 3 2 3 5 2 0 2 5 4 2 0 1
(Multiple Choice)
4.8/5 (33)
Filters
- Essay(0)
- Multiple Choice(0)
- Short Answer(0)
- True False(0)
- Matching(0)