Exam 2: Exploring Data With Tables and Graphs
Exam 1: Introduction to Statistics155 Questions
Exam 2: Exploring Data With Tables and Graphs132 Questions
Exam 3: Describing, Exploring, and Comparing Data225 Questions
Exam 4: Probability219 Questions
Exam 5: Discrete Probability Distributions205 Questions
Exam 6: Normal Probability Distributions254 Questions
Exam 7: Estimating Parameters and Determining Sample Sizes170 Questions
Exam 8: Hypothesis Testing187 Questions
Exam 9: Inferences From Two Samples192 Questions
Exam 10: Correlation and Regression174 Questions
Exam 11: Goodness-Of-Fit and Contingency Tables100 Questions
Exam 12: Analysis of Variance113 Questions
Exam 13: Nonparametric Tests121 Questions
Exam 14: Statistical Process Control90 Questions
Select questions type
Wagenlucht Ice Cream Company is always trying to create new flavors of ice cream. They are market testing three kinds to find out which one has the best chance of becoming popular. They give small samples of each to
20 people at a grocery store. Four ice cream tasters preferred the Strawberry Cream, 12 preferred Choco-Nuts, And four loved the Orange Mint. Construct a Pareto chart to represent these preferences. Choose the vertical Scale so that the relative frequencies are represented.
(Multiple Choice)
4.8/5  (41)
(41)
Use the high closing values of Naristar Inc. stock from the years 1992 - 2003 to construct a time-series graph. (Let x=0 represent 1992 and so on.) Identify a trend. Year High Year High 1992 48 1998 62 1993 53 1999 60 1994 47 2000 68 1995 55 2001 42 1996 58 2002 51 1997 61 2003 78
(Essay)
4.9/5 (36)
The frequency table below shows the number of days off in a given year for 30 police detectives. Days off Frequency 0-2 10 3-5 1 6-8 7 9-11 7 12-14 1 15-17 4 Construct a histogram. Use the class midpoints for the horizontal scale. Does the result appear to be a normal
distribution? Why or why not? 
(Essay)
4.9/5 (34)
Construct a pie chart representing the given data set.
-After reviewing a movie, 500 people rated the movie as excellent, good, or fair. The following data give the rating distribution. Excellent Good Fair 100 250 150

(Multiple Choice)
4.9/5 (29)
Use the data to create a stemplot.
-The following data consists of the weights (in pounds) of 15 randomly selected women and the weights of 15 randomly selected men. Construct a back-to-back stemplot for the data. Women: 128 150 118 166 142 122 137 110 175 152 145 126 139 111 170
Men: 140 153 199 186 169 136 176 162 196 155 173 190 141 166 153
(Multiple Choice)
4.9/5 (29)
Identify the cumulative frequency distribution that corresponds to the given frequency distribution. Speed Number of Cars 0-29 4 30-59 16 60-89 60 90-119 20
(Multiple Choice)
4.8/5 (43)
The following data represent the number of cars passing through a toll booth during a certain time period over a number of days. 38 39 37 37 44 38 41 38 39 35 42 39 43 37 41 Which of these choices display the correct dotplot?
(Multiple Choice)
4.9/5 (39)
Construct a frequency distribution and the corresponding histogram in which the following conditions are
satisfied:
- The frequency for the second class is twice the frequency of the first class.
- In the histogram, the area of the bar corresponding to the second class is four times the area of the bar
corresponding to the first class.
(Essay)
4.8/5 (35)
Construct a pie chart representing the given data set.
-The graph below shows the average cost of renting a studio in one city in each of the years 2002 through 2006.
By what percentage does the average price increase from 2002 to 2003? Obtain a second version of the graph by
sliding a piece of paper over the bottom of the graph so that the bars start at 300. In this new graph, by what
percentage does the price appear to increase from 2002 to 2003? Is the second graph misleading? 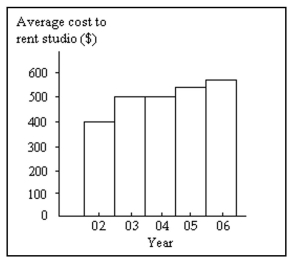
(Essay)
4.8/5 (45)
Construct one table that includes relative frequencies based on the two frequency distributions below. Do those
weights appear to be about the same or are they substantially different.? Round to the nearest tenth of a percent
if necessary. 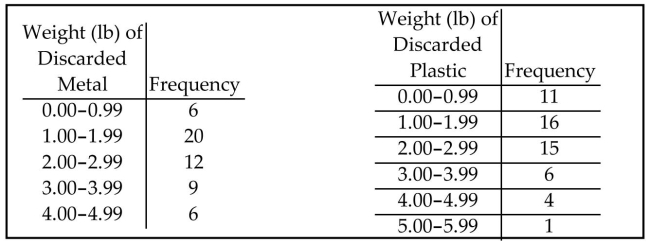
(Essay)
4.8/5 (46)
The two key parts of a regression equation involve the ________ and the y-________.
(Multiple Choice)
4.9/5 (36)
A nurse measured the blood pressure of each person who visited her clinic. Following is a relative-frequency histogram for the systolic blood pressure readings for those people aged between 25 and 40. The blood pressure
Readings were given to the nearest whole number. Approximately what percentage of the people aged 25-40
Had a systolic blood pressure reading between 110 and 119 inclusive? 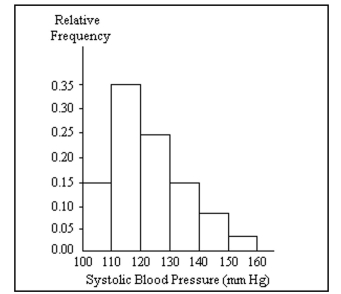
(Multiple Choice)
4.9/5 (34)
Filters
- Essay(0)
- Multiple Choice(0)
- Short Answer(0)
- True False(0)
- Matching(0)