Exam 2: Exploring Data With Tables and Graphs
Exam 1: Introduction to Statistics155 Questions
Exam 2: Exploring Data With Tables and Graphs132 Questions
Exam 3: Describing, Exploring, and Comparing Data225 Questions
Exam 4: Probability219 Questions
Exam 5: Discrete Probability Distributions205 Questions
Exam 6: Normal Probability Distributions254 Questions
Exam 7: Estimating Parameters and Determining Sample Sizes170 Questions
Exam 8: Hypothesis Testing187 Questions
Exam 9: Inferences From Two Samples192 Questions
Exam 10: Correlation and Regression174 Questions
Exam 11: Goodness-Of-Fit and Contingency Tables100 Questions
Exam 12: Analysis of Variance113 Questions
Exam 13: Nonparametric Tests121 Questions
Exam 14: Statistical Process Control90 Questions
Select questions type
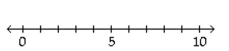
A store manager counts the number of customers who make a purchase in his store each day. The data are as follows. 10 11 8 14 7 10 10 11 8 7 Which of these choices display the correct dotplot?
(Multiple Choice)
4.9/5  (43)
(43)
Describe the differences between a histogram and a stemplot and discuss the advantages and disadvantages of
each.
(Essay)
4.9/5 (30)
Attendance records at a school show the number of days each student was absent during the year. The days absent for each student were as follows. 0 2 3 4 2 3 4 6 7 2 3 4 6 9 8
(Multiple Choice)
4.8/5 (30)
Use the data to create a stemplot.
-Twenty-four workers were surveyed about how long it takes them to travel to work each day. The data below are given in minutes. 20 35 42 52 65 20 60 49 24 37 23 24
22 20 41 25 28 27 50 47 58 30 32 48
(Multiple Choice)
4.7/5 (40)
Define the difference between a Relative Frequency Distribution and a Cumulative Frequency Distribution.
(Essay)
4.7/5 (32)
The following figures represent Latisha's monthly charges (in $) for long distance telephone calls for the past
twelve months. 7.12 10.40 14.70 18.24 10.48 16.47 7.53 15.45 13.04 15.48 13.33 12.56 Construct a frequency distribution with four classes. Charges \ Frequency
(Essay)
4.8/5 (39)
The frequency distribution below summarizes the home sale prices in the city of Summerhill for the month of June. Determine the width of each class.
(Multiple Choice)
4.8/5 (38)
The following frequency distribution depicts the scores on a math test. Find the class midpoint of scores for the interval 95-99. Scores Number of Students 75-79 2 80-84 4 85-89 6 90-94 15 95-99 5
(Multiple Choice)
4.9/5 (37)
Use the data to create a stemplot.
-The midterm test scores for the seventh-period typing class are listed below. \begin{tabular} { | l l l l l l l l l l l l l l l l } \hline 85 & 77 & 93 & 91 & 74 & 65 & 68 & 97 & 88 & 59 & 74 & 83 & 85 & 72 & 63 & 79 \end{tabular}
(Multiple Choice)
4.9/5 (41)
The frequency distribution below summarizes employee years of service for Alpha Corporation. Find the class midpoint for class 1-5. Years of service Frequency 1-5 5 6-10 20 11-15 25 16-20 10 21-25 5 26-30 3
(Multiple Choice)
4.9/5 (33)
The following frequency distribution displays the scores on a math test. Find the class boundaries of scores interval 40-59. Scores Number of Students 50-59 2 60-69 4 70-79 6 80-89 15 90-99 5
(Multiple Choice)
4.8/5 (34)
Use the data to create a stemplot.
-The normal monthly precipitation (in inches) for August is listed for 39 different U.S. cities. Construct an expanded stemplot with about 9 rows. 3.5 1.6 2.4 3.7 4.1 3.9 1.0 3.6 1.7 0.4 3.2 4.2 4.1
4.2 3.4 3.7 2.2 1.5 4.2 3.4 2.7 4.0 2.0 0.8 3.6 3.7
0.4 3.7 2.0 3.6 3.8 1.2 4.0 3.1 0.5 3.9 0.1 3.5 3.4
(Multiple Choice)
4.8/5 (43)
Solve the problem.
-120 casino patrons, were interviewed as they left the casino. 36 of them said they spent most of the time playing the slots. 36 of them said they played blackjack. 18 said they played craps. 6 said roulette. 6 said poker. The rest
Were not sure what they played the most. Construct a Pareto chart to depict the gaming practices of the group of
Casino goers. Choose the vertical scale so that the relative frequencies are represented. 
(Multiple Choice)
4.9/5 (31)
The following figures represent Jennifer's monthly charges for long distance telephone calls for the past twelve
months. 7.12 10.40 14.70 18.24 10.48 16.47 7.53 15.45 13.04 15.48 13.33 12.56 Construct a frequency distribution with 4 classes. Charges Frequency
(Essay)
4.8/5 (39)
The graph below shows the number of car accidents occurring in one city in each of the years 2011 through
2016. The number of accidents dropped in 2013 after a new speed limit was imposed. Does the graph distort the
data? How would you redesign the graph to be less misleading? 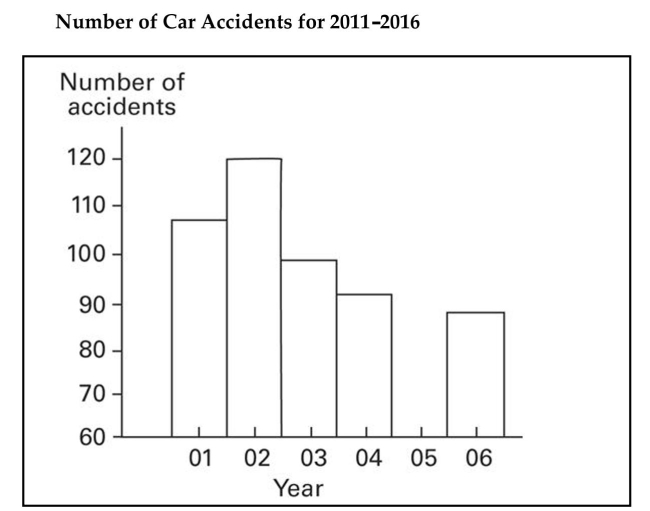
(Essay)
4.8/5 (39)
The frequency table below shows the amount of weight loss during the first month of a diet program for a
group of men. Constructing a frequency polygon. Applying a loose interpretation of the requirements for a
normal distribution, do the pounds of weight loss appear to be normally distributed? Why or why not? Weight (lb) Frequency 5-7 2 8-10 9 11-13 18 14-16 13 17-19 4 20-22 1
(Essay)
4.8/5 (43)
The Kappa Iota Sigma Fraternity polled its members on the weekend party theme. The vote was as follows: six for toga, four for hayride, eight for luau, and two for masquerade. Which of these choices display the correct
Pareto chart?
(Multiple Choice)
4.8/5 (39)
Solve the problem.
-A car dealer is deciding what kinds of vehicles he should order from the factory. He looks at his sales report for the preceding period. Choose the vertical scale so that the relative frequencies are represented. Vehicle Sales Economy 20 Sports 5 Family 35 Luxury 10 Truck 30
 Construct a Pareto chart to help him decide.
(Multiple Choice)
4.7/5 (31)
A manufacturer records the number of errors each work station makes during the week. The data are as follows. 6 3 2 3 5 2 0 2 5 4 2 0 1
(Multiple Choice)
4.8/5 (24)
Filters
- Essay(0)
- Multiple Choice(0)
- Short Answer(0)
- True False(0)
- Matching(0)