Exam 2: Exploring Data With Tables and Graphs
Exam 1: Introduction to Statistics155 Questions
Exam 2: Exploring Data With Tables and Graphs132 Questions
Exam 3: Describing, Exploring, and Comparing Data225 Questions
Exam 4: Probability219 Questions
Exam 5: Discrete Probability Distributions205 Questions
Exam 6: Normal Probability Distributions254 Questions
Exam 7: Estimating Parameters and Determining Sample Sizes170 Questions
Exam 8: Hypothesis Testing187 Questions
Exam 9: Inferences From Two Samples192 Questions
Exam 10: Correlation and Regression174 Questions
Exam 11: Goodness-Of-Fit and Contingency Tables100 Questions
Exam 12: Analysis of Variance113 Questions
Exam 13: Nonparametric Tests121 Questions
Exam 14: Statistical Process Control90 Questions
Select questions type
Identify the cumulative frequency distribution that corresponds to the given frequency distribution. Speed Number of Cars 0-29 4 30-59 16 60-89 60 90-119 20
(Multiple Choice)
4.9/5  (35)
(35)
The frequency distribution below summarizes employee years of service for Alpha Corporation. Find the class midpoint for class 1-5. Years of Service Frequency 1-5 5 6-10 20 11-15 25 16-20 10 21-25 5 26-30 3
(Multiple Choice)
4.9/5 (42)
The scores on a recent statistics test are given in the frequency distribution below. Construct the corresponding relative frequency distribution. Round relative frequencies to the nearest hundredth of a percent if necessary. Scores Frequency 0-60 3 61-70 10 71-80 11 81-90 4 91-100 1
(Multiple Choice)
4.8/5 (36)
The following frequency distribution analyzes the scores on a math test. Find the class boundaries of scores interval 90-99. Scores Number of students 50-59 2 60-69 4 70-79 6 80-89 15 90-99 5
(Multiple Choice)
4.8/5 (35)
A nurse measured the blood pressure of each person who visited her clinic. Following is a relative-frequency histogram for the systolic blood pressure readings for those people aged between 25 and 40 years. The blood
Pressure readings (in mm Hg) were given to the nearest whole number. What class width was used to construct
The relative frequency distribution? 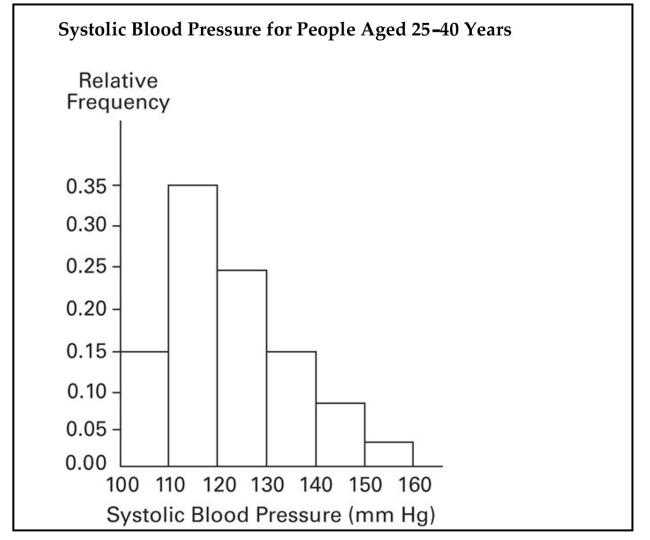
(Multiple Choice)
4.7/5 (42)
Analysis of the data from 25 mothers indicates that an infant's birth weight (g), y, can be estimated by a mother's weight (kg), x, using the regression equation y = 31x + 1501. If a mother's weight is 70 kg, the infant's birth
Weight can be estimated as ________ g.
(Multiple Choice)
4.8/5 (37)
The frequency distribution below summarizes employee years of service for Alpha Corporation. Determine the width of each class. Years of service Frequency 1-5 5 6-10 20 11-15 25 16-20 10 21-25 5 26-30 3
(Multiple Choice)
4.8/5 (36)
A nurse measured the blood pressure of each person who visited her clinic. Following is a relative-frequency histogram for the systolic blood pressure readings for those people aged between 25 and 40 years. The blood
Pressure readings were given to the nearest whole number. Approximately what percentage of the people aged
25-40 had a systolic blood pressure reading between 110 and 139 mm Hg inclusive?
Systolic Blood Pressure for People Aged 25-40 Years 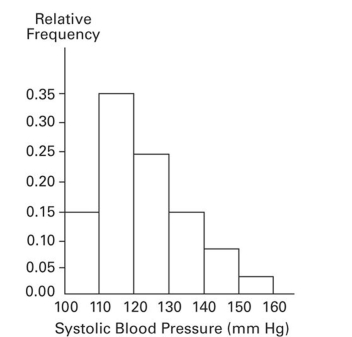
(Multiple Choice)
4.7/5 (34)
Lori asked 24 students how many hours they had spent doing homework during the previous week. The results
are shown below. 10 10 10 8 10 10 14 13 10 8 12 10 10 12 10 10 12 10 10 13 10 12 13 8 Construct a frequency distribution. Use 4 classes, a class width of 2 hours, and a lower limit of 8 for Hours Frequency
(Essay)
4.9/5 (42)
The Kappa Iota Sigma Fraternity polled its members on the weekend party theme. The vote was as follows: six for toga, four for hayride, eight for luau, and two for masquerade. Display the vote count in a Pareto chart.
(Multiple Choice)
5.0/5 (45)
Describe how a data point labeled as an outlier can affect the analysis of a data set in a frequency distribution or
histogram.
(Essay)
4.8/5 (44)
Construct a pie chart representing the given data set.
-Explain in your own words why a bar graph can be misleading if one or both of the scales begin at some value
other than zero.
(Essay)
5.0/5 (41)
The frequency distribution below summarizes employee years of service for Alpha Corporation. Determine the width of each class. Years of Service Frequency 1-5 5 6-10 20 11-15 25 16-20 10 21-25 5 26-30 3
(Multiple Choice)
4.9/5 (41)
Construct a pie chart representing the given data set.
-The data shows the roundtrip mileage that 43 randomly selected students drive to school each day. Construct a
frequency polygon. Applying a loose interpretation of the requirements for a normal distribution, do the
mileages appear to be normally distributed? Why or why not? Miles Frequency 10-14 0 15-19 6 20-24 9 25-29 21 30-34 7
(Essay)
4.7/5 (36)
The attendance counts for this season's basketball games are listed below. Which of these choices display the correct stemplot? 227 239 215 219
221 233 229 233
235 228 245 231
(Multiple Choice)
5.0/5 (36)
The histogram below represents the number of television sets per household for a sample of U.S. households. What is the class width? 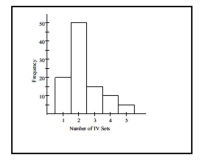
(Multiple Choice)
4.8/5 (34)
Use the data to create a stemplot.
-The weights of 22 members of the varsity football team are listed below. 144 152 142 151 160 152 131 164 141 153 140
144 175 156 147 133 172 159 135 159 148 171
(Multiple Choice)
4.8/5 (34)
Which choice displays the best graphic display of the amount of nitrous oxide (NO) explained by the amount of carbon monoxide (CO) emissions in million metric tons over a ten year period in the United States? The data set
Is below: CO 5638 5708 5893 5807 5881 5939 6024 6032 5946 6022 NO 351 349 345 339 335 335 362 371 376 384
(Multiple Choice)
4.8/5 (33)
The data shows the roundtrip mileage that 43 randomly selected students drive to school each day. Construct a
frequency polygon. Applying a loose interpretation of the requirements for a normal distribution, do the
mileages appear to be normally distributed? Why or why not? Miles Frequency 10-14 0 15-19 6 20-24 9 25-29 21 30-34 7
(Essay)
4.7/5 (41)
Solve the problem.
-At the National Criminologists Association's annual convention, participants filled out a questionnaire asking what they thought was the most important cause for criminal behavior. The tally was as follows. Cause Frequency education 31.9 drugs 95.7 family 63.8 poverty 111.65 other 15.95
 Construct a Pareto chart to display these findings.
(Multiple Choice)
4.7/5 (37)
Filters
- Essay(0)
- Multiple Choice(0)
- Short Answer(0)
- True False(0)
- Matching(0)