Exam 1: Describing Data With Graphs
Exam 1: Describing Data With Graphs94 Questions
Exam 2: Describing Data With Numerical Measures186 Questions
Exam 3: Describing Bivariate Data35 Questions
Exam 4: Probability and Probability Distributions136 Questions
Exam 5: Several Useful Discrete Distributions129 Questions
Exam 6: The Normal Probability Distribution196 Questions
Exam 7: Sampling Distributions162 Questions
Exam 8: Large-Sample Estimation173 Questions
Exam 9: Large-Sample Tests of Hypotheses210 Questions
Exam 10: Inference From Small Samples261 Questions
Exam 11: The Analysis of Variance156 Questions
Exam 12: Linear Regression and Correlation165 Questions
Exam 13: Multiple Regression Analysis178 Questions
Exam 14: Analysis of Categorical Data136 Questions
Exam 15: Nonparametric Statistics198 Questions
Select questions type
A tabular summary of categorical data set showing the number of observations that fall into each of several collectively exhaustive and mutually exclusive classes is called a bar chart.
(True/False)
4.8/5  (37)
(37)
A relative frequency distribution is a tabular summary of a data set showing the proportions of all observations that fall into each of several collectively exhaustive and mutually exclusive classes.
(True/False)
4.8/5 (32)
A relative frequency distribution describes the proportion of data values that fall within each class, and may be presented in a histogram form.
(True/False)
4.7/5 (38)
A listing of data in order of ascending or descending magnitude is called:
(Multiple Choice)
4.8/5 (36)
Time series data are often graphically depicted on a line chart, which is a plot of the variable of interest over time.
(True/False)
4.8/5 (29)
A histogram is a graphical device that is commonly used to analyze:
(Multiple Choice)
4.9/5 (36)
One of the differences between a bar chart and a histogram is that a histogram typically displays data in a percentage form.
(True/False)
4.9/5 (28)
A single observation about s specified characteristic of interest is:
(Multiple Choice)
4.8/5 (34)
Given 180 observations, a data class with an absolute class frequency of 36 must have a relative class frequency of:
(Multiple Choice)
4.9/5 (31)
The total area of the six bars in a relative frequency histogram for which the width of each bar is ten units is:
(Multiple Choice)
4.9/5 (29)
In a sample of 1000 students in a university, 125 of them or 12.5% are biology majors. The 12.5% is an example of statistical inference.
(True/False)
4.9/5 (32)
Characteristics possessed by experimental units are called:
(Multiple Choice)
4.7/5 (32)
A math teacher would like to present the midterm results to her class in a way that shows the overall spread of the data. The 25 test scores for the midterm are listed below.
a. Construct a dotplot.
45 78 62 98 50 61 91 89 57 64 77 69 82 73 70 73 79 80 68 72 62 65 78 50 95
b. Explain what the plot tells us.
________________________________________________________
(Essay)
4.8/5 (35)
The librarian of a small community library has compiled the number of people who visited the library and the respective number of checked-out books, and created the line chart shown below: 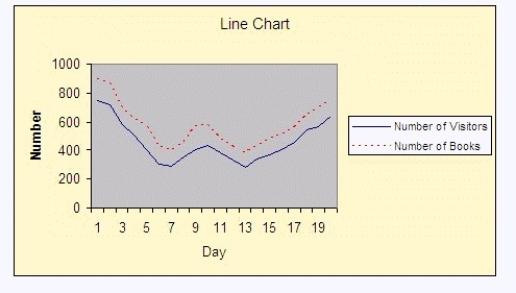 Interpret the chart, where the solid line is the number of visitors and the dashed line is the number of books checked-out.
________________________________________________________
Interpret the chart, where the solid line is the number of visitors and the dashed line is the number of books checked-out.
________________________________________________________
(Essay)
4.9/5 (34)
A qualitative variable about which observations can be made in only two categories is a bivariate data set.
(True/False)
4.9/5 (34)
Persons or objects that have characteristics of interest to statisticians are called variables.
(True/False)
4.8/5 (30)
The freshness and overall quality of milk depend upon the type of packaging used. The manager of a dairy company is considering changing the packaging from cartons to plastic. The quality control team of this dairy company packaged milk in 100 containers of each type of material. After a specific amount of time, the team tested the milk for freshness and overall quality. Identify the population and sample in this problem.
Population: ________________________________________________________
Sample: ________________________________________________________
(Essay)
4.7/5 (28)
The set of all possible observations about a specified characteristic of interest is:
(Multiple Choice)
4.9/5 (39)
The data values plotted on a line graph are connected with a straight line between each pair of successive points.
(True/False)
5.0/5 (48)
Filters
- Essay(0)
- Multiple Choice(0)
- Short Answer(0)
- True False(0)
- Matching(0)