Exam 53: Introduction to Ecology Population Ecology
Exam 1: A View of Life66 Questions
Exam 2: Atoms and Molecules the Chemical Basis of Life69 Questions
Exam 3: The Chemistry of Life Organic Compounds68 Questions
Exam 4: Organization of the Cell71 Questions
Exam 5: Biological Membranes69 Questions
Exam 6: Cell Communication69 Questions
Exam 7: Energy and Metabolism73 Questions
Exam 8: How Cells Make Atp Energy-Releasing Pathways66 Questions
Exam 9: Photosynthesis Capturing Light Energy72 Questions
Exam 10: Chromosomes, Mitosis, and Meiosis66 Questions
Exam 11: The Basic Principles of Heredity78 Questions
Exam 12: Dna the Carrier of Genetic Information68 Questions
Exam 13: Gene Expression82 Questions
Exam 14: Gene Regulation77 Questions
Exam 15: Dna Technology and Genomics81 Questions
Exam 16: Human Genetics and the Human Genome75 Questions
Exam 17: Developmental Genetics83 Questions
Exam 18: Introduction to Darwinian Evolution66 Questions
Exam 19: Evolutionary Change in Populations72 Questions
Exam 20: Speciation and Macroevolution139 Questions
Exam 21: The Origin and Evolutionary History of Life67 Questions
Exam 22: The Evolution of Primates70 Questions
Exam 23: Understanding Diversity Systematics66 Questions
Exam 24: Viruses and Subviral Agents51 Questions
Exam 25: Bacteria and Archaea59 Questions
Exam 26: Protists69 Questions
Exam 27: Seedless Plants70 Questions
Exam 28: Seed Plants69 Questions
Exam 29: The Fungi69 Questions
Exam 30: An Introduction to Animal Diversity66 Questions
Exam 31: Sponges, Cnidarians, Ctenophores, and Protostomes99 Questions
Exam 32: The Deuterostomes75 Questions
Exam 33: Plant Structure Growth and Development73 Questions
Exam 34: Leaf Structure and Function76 Questions
Exam 35: Stem Structure and Transport75 Questions
Exam 36: Roots and Mineral Nutrition84 Questions
Exam 37: Reproduction in Flowering Plants81 Questions
Exam 38: Plant Developmental Responses to External and Internal Signals84 Questions
Exam 39: Animal Structure and Function an Introduction84 Questions
Exam 40: Protection Support and Movement68 Questions
Exam 41: Neural Signaling66 Questions
Exam 42: Neural Regulation67 Questions
Exam 43: Sensory Systems78 Questions
Exam 44: Internal Transport90 Questions
Exam 45: The Immune System Internal Defense79 Questions
Exam 46: Gas Exchange93 Questions
Exam 47: Processing Food and Nutrition90 Questions
Exam 48: Osmoregulation and Disposal of Metabolic Wastes111 Questions
Exam 49: Endocrine Regulation69 Questions
Exam 50: Reproduction95 Questions
Exam 51: Animal Development88 Questions
Exam 52: Animal Behavior83 Questions
Exam 53: Introduction to Ecology Population Ecology90 Questions
Exam 54: Community Ecology73 Questions
Exam 55: Ecosystems and the Biosphere91 Questions
Exam 56: Ecology and the Geography of Life81 Questions
Exam 57: Biological Diversity and Conservation Biology68 Questions
Select questions type
People overpopulation is the current problem in many developing nations.
Free
(True/False)
4.8/5  (35)
(35)
Correct Answer: Verified
True
Figure 53-6 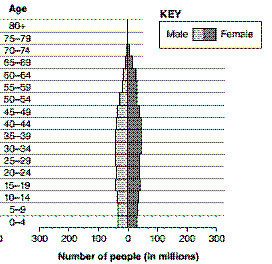 Figure 53-6 represents the age structure diagram of:
Free
(Multiple Choice)
5.0/5 (36)
Correct Answer:Verified
E
An example of a density-dependent factor that influences the size of a population is:
Free
(Multiple Choice)
4.8/5 (31)
Correct Answer:Verified
D
Figure 53-3 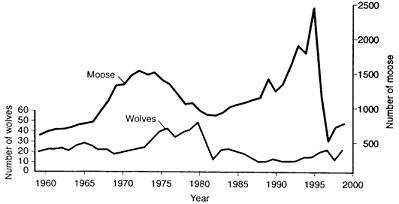 According to the data in the accompanying figure, the cause of the decline of the wolf population in 1982 was:
(Multiple Choice)
4.9/5 (32)
Figure 53-6  Refer to the accompanying figure. Assuming the pattern remains the same, what will the population experience in 50 years?
(Multiple Choice)
4.8/5 (36)
Differentiate between density-dependent and density-independent factors affecting population growth. Provide two examples for each, along with a brief explanation.
(Essay)
4.9/5 (36)
Consumption overpopulation occurs when each individual in a population consumes too large a share of resources.
(True/False)
4.8/5 (42)
____ generally have greater population densities than less suitable sites.
(Multiple Choice)
4.8/5 (38)
Compare and contrast Type I and Type III survivorship curves. Sketch a correctly labeled graph to support your comparison. BONUS: Identify two organisms that represent each of the two types of survivorship strategies discussed here.
(Essay)
4.8/5 (36)
Which of the following series correctly represents the hierarchical organization within ecology?
(Multiple Choice)
4.9/5 (35)
What British clergyman and economist was one of the first to recognize that the human population cannot continue to increase indefinitely?
(Multiple Choice)
4.9/5 (34)
Organisms such as oysters or fish that produce millions of eggs per year may be characterized as:
(Multiple Choice)
4.8/5 (36)
Figure 53-2  The accompanying figure models a(n) __________-shaped growth curve.
(Multiple Choice)
4.8/5 (41)
Figure 53-2  Refer to the accompanying figure. At which point on the graph is the population increasing exponentially?
(Multiple Choice)
4.9/5 (35)
Source habitats are areas where reproductive success is less than local mortality.
(True/False)
4.9/5 (39)
Figure 53-2 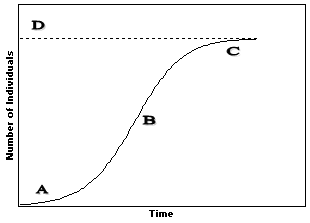 On the accompanying figure, identify the point that indicates the carrying capacity for this population.
(Multiple Choice)
4.9/5 (37)
In a human population with a high proportion of prereproductive individuals, the population will:
(Multiple Choice)
4.9/5 (37)
Figure 53-5 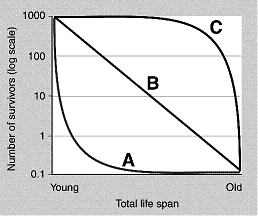 Refer to the accompanying figure. A population that produces a large number of offspring, but the offspring must survive independently, would be represented by the curve labeled:
(Multiple Choice)
4.8/5 (36)
Filters
- Essay(0)
- Multiple Choice(0)
- Short Answer(0)
- True False(0)
- Matching(0)