Exam 2: Describing Data: Numerical
Exam 1: Describing Data: Graphical247 Questions
Exam 2: Describing Data: Numerical326 Questions
Exam 3: Probability345 Questions
Exam 4: Discrete Random Variables and Probability Distributions257 Questions
Exam 5: Continuous Random Variables and Probability Distributions239 Questions
Exam 6: Sampling and Sampling Distributions147 Questions
Exam 7: Estimation: Single Population151 Questions
Exam 8: Estimation: Additional Topics109 Questions
Exam 9: Hypothesis Testing: Single Population164 Questions
Exam 10: Hypothesis Testing: Additional Topics103 Questions
Exam 11: Simple Regression217 Questions
Exam 12: Multiple Regression252 Questions
Exam 13: Additional Topics in Regression Analysis168 Questions
Exam 14: Analysis of Categorical Data241 Questions
Exam 15: Analysis of Variance192 Questions
Exam 16: Time-Series Analysis and Forecasting138 Questions
Exam 17: Additional Topics in Sampling110 Questions
Select questions type
Which of the following is used as a divisor in the sample variance s2,where n is the sample size?
(Multiple Choice)
4.9/5  (39)
(39)
A distribution which contains a relatively small proportion of low values is said to be:
(Multiple Choice)
4.8/5 (35)
Calculate the first,second,and third quartiles of the following sample:

(Essay)
4.8/5 (36)
The shift supervisor at a local manufacturing plant collected data on the number of defects coming off an assembly line over the past eight weeks (40 work days).She summarized the data in the following frequency table.
 What is the weighted average number of errors per night?
(Essay)
4.8/5 (40)
For the following three samples,for which sample is the data most closely grouped about the sample mean? Give a written explanation that supports your conclusion.
Sample 1: 15,16,19,21,28;
Sample 2: 44,49,50,51,57;and
Sample 3: 122.8,123.7,124.6,130.5,135.8.
(Essay)
4.9/5 (37)
The standard deviation,as a measure of variation (dispersion),can be understood by examining two statements that tell us how the standard deviation relates to the data: the Empirical Rule and Chebyshev's Theorem.
(True/False)
4.7/5 (38)
A student scores 89,75,94,and 88 on four exams during the semester and 97 on the final exam.If the final is weighted double and the four others weighted equally,the student's final average would be 90.
(True/False)
4.7/5 (42)
THE NEXT QUESTIONS ARE BASED ON THE FOLLOWING INFORMATION:
Consider the following scores on a 20 point aptitude test for two samples of eight students each:
Sample 1: 18,19,17,15,14,20,14,and 16
Sample 2: 14,15,13,11,10,16,10,and 12
-Calculate the mean score in sample 1.
(Essay)
4.8/5 (33)
The interquartile range measures the spread of the middle 50% of the data.
(True/False)
4.7/5 (27)
A variable measured at the interval or ratio level can have more than one arithmetic mean.
(True/False)
4.9/5 (39)
THE NEXT QUESTIONS ARE BASED ON THE FOLLOWING INFORMATION:
The number of students eating breakfast at the school dining commons was recorded over 110 days last semester.These data are presented below.
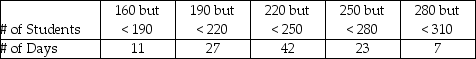 -Calculate the quantities
  ,
, 
 ,and
,and 
 .
.
(Essay)
4.9/5 (31)
To find percentiles and quantities,data must be first arranged in:
(Multiple Choice)
4.9/5 (37)
Measures of central tendency are usually computed from population data rather than from sample data.
(True/False)
4.8/5 (35)
The 30th percentile,P30,is a value such that at most 30% of the data are smaller in value than P30 and at most 70% of the data are larger.
(True/False)
4.7/5 (37)
The covariance of the following sample data of four (X,Y)pairs: (1,5),(2,10),(4,7),and (5,9)equals:
(Multiple Choice)
5.0/5 (33)
THE NEXT QUESTIONS ARE BASED ON THE FOLLOWING INFORMATION:
A small accounting office is trying to determine its staffing needs for the coming tax season.The manager has collected the following data: 46,27,79,57,99,75,48,89,and 85.These values represent the number of returns the office completed each year over the entire nine years it has been doing tax returns.
-For this data,what is the interquartile for the number of tax returns completed each year?
(Essay)
4.9/5 (33)
The numerical measures mean,median,and mode provide information concerning the:
(Multiple Choice)
4.8/5 (39)
The median can be determined for any set of ordinal,interval or ratio-level data.
(True/False)
4.8/5 (37)
If the mean is greater than the median,then the distribution is skewed to the right.
(True/False)
4.8/5 (30)
Filters
- Essay(0)
- Multiple Choice(0)
- Short Answer(0)
- True False(0)
- Matching(0)