Exam 2: Describing Data: Numerical
Exam 1: Describing Data: Graphical247 Questions
Exam 2: Describing Data: Numerical326 Questions
Exam 3: Probability345 Questions
Exam 4: Discrete Random Variables and Probability Distributions257 Questions
Exam 5: Continuous Random Variables and Probability Distributions239 Questions
Exam 6: Sampling and Sampling Distributions147 Questions
Exam 7: Estimation: Single Population151 Questions
Exam 8: Estimation: Additional Topics109 Questions
Exam 9: Hypothesis Testing: Single Population164 Questions
Exam 10: Hypothesis Testing: Additional Topics103 Questions
Exam 11: Simple Regression217 Questions
Exam 12: Multiple Regression252 Questions
Exam 13: Additional Topics in Regression Analysis168 Questions
Exam 14: Analysis of Categorical Data241 Questions
Exam 15: Analysis of Variance192 Questions
Exam 16: Time-Series Analysis and Forecasting138 Questions
Exam 17: Additional Topics in Sampling110 Questions
Select questions type
Which of the following represents a disadvantage of using the sample range to measure spread or dispersion?
(Multiple Choice)
4.9/5  (23)
(23)
THE NEXT QUESTIONS ARE BASED ON THE FOLLOWING INFORMATION:
The following data represents the number of minutes an athlete spends training per day.
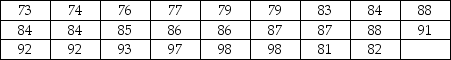 The mean and standard deviation were computed to be 85.54 and 6.97,respectively.The median is 85.5
-What percentage of measurements would you expect to be between 71.60 and 99.48?
The mean and standard deviation were computed to be 85.54 and 6.97,respectively.The median is 85.5
-What percentage of measurements would you expect to be between 71.60 and 99.48?
(Essay)
4.8/5 (33)
THE NEXT QUESTIONS ARE BASED ON THE FOLLOWING INFORMATION:
Consider the following observations on shear strength of a joint bonded in a particular manner:
 -Determine the value of the sample mean.
(Essay)
4.8/5 (39)
For any set of numerical data values arranged in an ascending or descending order,the value of the observation in the center is called the weighted mean.
(True/False)
4.8/5 (37)
A researcher interested in determining the average monthly expenditures of college students on DVDs finds that for a sample of 25 students,the mean expenditure was $24.40,and the median expenditure was $21.76.Specify the shape of the histogram for this data.Does this shape make sense? Why?
(Essay)
4.9/5 (27)
If the mean of a quantitative data set exceeds the median,the data are considered to be symmetrical.
(True/False)
4.8/5 (25)
THE NEXT QUESTIONS ARE BASED ON THE FOLLOWING INFORMATION:
Consider the following scores on a 20 point aptitude test for two samples of eight students each:
Sample 1: 18,19,17,15,14,20,14,and 16
Sample 2: 14,15,13,11,10,16,10,and 12
-Calculate the mean score in sample 2.
(Essay)
4.7/5 (24)
What is the relationship among the mean,median,and mode in a symmetrical distribution?
(Multiple Choice)
4.8/5 (33)
When extreme values are present in a set of data,which pair of the following descriptive summary measures of central tendency and dispersion is most appropriate?
(Multiple Choice)
4.9/5 (30)
THE NEXT QUESTIONS ARE BASED ON THE FOLLOWING INFORMATION:
Chebyshev's theorem is used to approximate the proportion of observations for any data set,regardless of the shape of the distribution.Assume that a distribution has a mean of 255 and standard deviation of 20.
-Approximately what proportion of the observations is between 215 and 295?
(Essay)
4.7/5 (32)
THE NEXT QUESTIONS ARE BASED ON THE FOLLOWING INFORMATION:
A sample of 33 students was asked to rate themselves on whether they were outgoing or not using this five point scale: 1 = extremely extroverted,2 = extroverted,3 = neither extroverted nor introverted,4 = introverted,or 5 = extremely introverted.The results are shown in the table below:
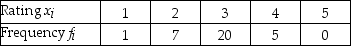 -Calculate the median.
(Essay)
4.9/5 (38)
THE NEXT QUESTIONS ARE BASED ON THE FOLLOWING INFORMATION:
An investment councilor recently reviewed the account activity of a sample of 10 of his clients and calculated the average number of stock trades per month over the past year for each client.He obtained the following data values: 10.2,2.5,11.4,3.2,1.1,3.4,8.4,9.7,11.2,and 2.4
-Calculate the median number of trades per month for these 10 clients.
(Essay)
4.8/5 (33)
THE NEXT QUESTIONS ARE BASED ON THE FOLLOWING INFORMATION:
The following data represent scores on a 15 point aptitude test: 8,10,15,12,14,and 13.
-Subtract 5 from every observation and compute the sample mean for the original data and the new data.
(Essay)
5.0/5 (31)
The coefficient of variation measures variability in a positively skewed data set relative to the size of the median.
(True/False)
4.8/5 (35)
One possible source of skewness is the presence of outliers,and sometimes skewness is simply inherent in the distribution.
(True/False)
4.7/5 (35)
The mean is a better measure of central tendency than the median when there are outliers.
(True/False)
4.9/5 (33)
Measures of central tendency provide numerical information about a "typical" observation in the data.
(True/False)
4.9/5 (40)
For salaries of $108,000,$102,000,$52,000,$105,000,107,000 and $101,000,the arithmetic mean would be an appropriate measure of central tendency.
(True/False)
4.8/5 (32)
Filters
- Essay(0)
- Multiple Choice(0)
- Short Answer(0)
- True False(0)
- Matching(0)