Exam 2: Describing Data: Numerical
Exam 1: Describing Data: Graphical247 Questions
Exam 2: Describing Data: Numerical326 Questions
Exam 3: Probability345 Questions
Exam 4: Discrete Random Variables and Probability Distributions257 Questions
Exam 5: Continuous Random Variables and Probability Distributions239 Questions
Exam 6: Sampling and Sampling Distributions147 Questions
Exam 7: Estimation: Single Population151 Questions
Exam 8: Estimation: Additional Topics109 Questions
Exam 9: Hypothesis Testing: Single Population164 Questions
Exam 10: Hypothesis Testing: Additional Topics103 Questions
Exam 11: Simple Regression217 Questions
Exam 12: Multiple Regression252 Questions
Exam 13: Additional Topics in Regression Analysis168 Questions
Exam 14: Analysis of Categorical Data241 Questions
Exam 15: Analysis of Variance192 Questions
Exam 16: Time-Series Analysis and Forecasting138 Questions
Exam 17: Additional Topics in Sampling110 Questions
Select questions type
THE NEXT QUESTIONS ARE BASED ON THE FOLLOWING INFORMATION:
Chebyshev's theorem is used to approximate the proportion of observations for any data set,regardless of the shape of the distribution.Assume that a distribution has a mean of 255 and standard deviation of 20.
-Approximately what proportion of the observations is between 195 and 315?
(Essay)
4.7/5  (41)
(41)
THE NEXT QUESTIONS ARE BASED ON THE FOLLOWING INFORMATION:
You are interested in looking at the relationship between the number of people on the sales force and the dollar volume of sales.The following data show gross sales,Y,measured in millions of dollars,and the number of people on the sales force,X,in the form of (x,y)pairs for 12 people: (15,34),(24,55),(27,67),(16,31),(19,32),(26,44),(19,39),(23,46),(26,53),(22,43),(28,45),and (17,41).
-Prepare a scatter plot of this data.
(Essay)
4.8/5 (35)
The coefficient of variation (CV)is a measure of relative dispersion that expresses the standard deviation as a percentage of the mean (provided the mean is positive).
(True/False)
4.8/5 (34)
THE NEXT QUESTIONS ARE BASED ON THE FOLLOWING INFORMATION:
Production records for an automobile manufacturer show the following figures for production per shift (maximum production is 720 cars per shift):
 -Would the mode be a useful summary statistic for these data? Why?
(Essay)
4.9/5 (37)
A z-score is a standardized value that indicates the number of standard deviations a value is from the mode.
(True/False)
4.8/5 (41)
The 5-number summary divides a set of data into four subsets,with one quartile of the data in each subset.
(True/False)
4.9/5 (27)
THE NEXT QUESTIONS ARE BASED ON THE FOLLOWING INFORMATION:
In a recent survey,12 students at a local university were asked approximately how many hours per week they spend on the Internet.Their responses were: 13,0,5,8,22,7,3,0,15,12,13,and 17.
-What are the mean and standard deviation for this data?
(Essay)
4.9/5 (34)
THE NEXT QUESTIONS ARE BASED ON THE FOLLOWING INFORMATION:
A set of data is mounded,with a mean of 500 and a variance of 576.
-Approximately what proportion of the observations is greater than 476?
(Essay)
5.0/5 (33)
For a set of numerical data values arranged in ascending order,the value of the observation in the center is called the geometric mean.
(True/False)
4.7/5 (33)
According to Chebyshev's Theorem,at least what percent of the observations lie within ±1.25 standard deviations of the mean?
(Multiple Choice)
4.8/5 (28)
THE NEXT QUESTIONS ARE BASED ON THE FOLLOWING INFORMATION:
A sample of eight doctors was asked how many flu shots they had given to patients this fall.The numbers of flu shots were 6,3,5,24,2,6,0,and 8.
-Find the sample mean.
(Essay)
4.8/5 (41)
Consider two possible investments with the same expected rate of return.Over the past several months,investment A has had an average closing price of $14.00 and a standard deviation of $4.00.Investment B has had an average closing price of $58.00 and a standard deviation of $15.00.The market value of investment A fluctuates relatively more than investment B.
(True/False)
4.8/5 (26)
Which of the following summary measures is affected most by outliers?
(Multiple Choice)
4.9/5 (35)
A distribution which contains a relatively small proportion of high values is said to be:
(Multiple Choice)
4.8/5 (42)
The Empirical Rule states that the percentage of observations in a data set (providing that the data set has a bell-shaped and symmetric distribution)that fall within one standard deviation of their mean is approximately:
(Multiple Choice)
4.8/5 (38)
A graphical representation of the five-number summary is called a box-and-whisker plot.
(True/False)
4.9/5 (27)
If the mean of a symmetrical data set is less than the median,the data are considered to be negatively skewed.
(True/False)
4.8/5 (33)
THE NEXT QUESTIONS ARE BASED ON THE FOLLOWING INFORMATION:
Consider the following (x,y)sample data: (40,13),(15,33),(16,42),(39,9),(20,38),(35,15),(25,21),(34,17),(20,24),and (34,21). 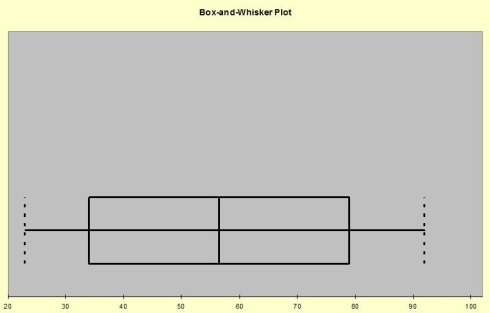 -Calculate the variances
  and
and  ,and the covariance sxy of the sample data.
(Essay)
4.9/5 (28)
What would be a reasonable estimate for the 99th percentile?
(Multiple Choice)
4.8/5 (34)
Filters
- Essay(0)
- Multiple Choice(0)
- Short Answer(0)
- True False(0)
- Matching(0)