Exam 2: Describing Data: Numerical
Exam 1: Describing Data: Graphical247 Questions
Exam 2: Describing Data: Numerical326 Questions
Exam 3: Probability345 Questions
Exam 4: Discrete Random Variables and Probability Distributions257 Questions
Exam 5: Continuous Random Variables and Probability Distributions239 Questions
Exam 6: Sampling and Sampling Distributions147 Questions
Exam 7: Estimation: Single Population151 Questions
Exam 8: Estimation: Additional Topics109 Questions
Exam 9: Hypothesis Testing: Single Population164 Questions
Exam 10: Hypothesis Testing: Additional Topics103 Questions
Exam 11: Simple Regression217 Questions
Exam 12: Multiple Regression252 Questions
Exam 13: Additional Topics in Regression Analysis168 Questions
Exam 14: Analysis of Categorical Data241 Questions
Exam 15: Analysis of Variance192 Questions
Exam 16: Time-Series Analysis and Forecasting138 Questions
Exam 17: Additional Topics in Sampling110 Questions
Select questions type
Questions concerning the location or position of a value relative to the entire set of data are answered by examining measures of location such as percentiles and quartiles.
(True/False)
4.9/5  (43)
(43)
The Empirical rule applies to any distribution,regardless of its shape,as an interpretive guide to the distribution.
(True/False)
4.8/5 (32)
According to the Empirical Rule,the percentage of observations in a data set (providing that the data set has a bell-shaped and symmetric distribution)that should fall within two standard deviations of their mean is approximately:
(Multiple Choice)
4.8/5 (26)
THE NEXT QUESTIONS ARE BASED ON THE FOLLOWING INFORMATION:
A set of data is mounded,with a mean of 500 and a variance of 576.
-Approximately what proportion of the observations is less than 548?
(Essay)
4.8/5 (41)
How well does the Empirical Rule work for the fraction of data actually falling within ± one standard deviation of the mean?
(Essay)
4.8/5 (35)
THE NEXT QUESTIONS ARE BASED ON THE FOLLOWING INFORMATION:
Consider the following (x,y)sample data:
(24,24),(19,33),(21,31),(10,36),(22,30),(13,36),(21,32),(23,26),(20,26),and
(21,31).
-Compute and interpret b1;the slope of the least squares regression line.
(Essay)
4.7/5 (37)
For any set of grouped or ungrouped data,which measures of central location always have only one value?
(Multiple Choice)
4.9/5 (31)
THE NEXT QUESTIONS ARE BASED ON THE FOLLOWING INFORMATION:
Calculate the following sample observations on fracture strength:
128,131,142,168,87,93,105,114,96,and 98.
-Calculate and interpret the value of the sample mean
(Essay)
4.9/5 (34)
THE NEXT QUESTIONS ARE BASED ON THE FOLLOWING INFORMATION:
The police lieutenant in charge of the traffic division has reviewed the number of traffic citations issued per day by each of the 10 police officers in his division.The data were: 13,21,12,34,31,13,22,26,25,and 23.
-What is the third quartile of the number of citations issued per day?
(Multiple Choice)
4.8/5 (29)
The interquartile range is very unique in the sense that it is a measure of central tendency as well as a measure of dispersion.
(True/False)
4.8/5 (39)
What conclusions can you draw about the relationship between age and net wealth?
(Essay)
4.9/5 (36)
THE NEXT QUESTIONS ARE BASED ON THE FOLLOWING INFORMATION:
A sample of 33 students was asked to rate themselves on whether they were outgoing or not using this five point scale: 1 = extremely extroverted,2 = extroverted,3 = neither extroverted nor introverted,4 = introverted,or 5 = extremely introverted.The results are shown in the table below:
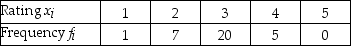 -Calculate the sample standard deviation.
(Essay)
4.9/5 (35)
For the sample data shown below,compute the five-number summary,and sketch out the Box-and-Whisker plot.

(Essay)
4.9/5 (38)
Measures of central tendency provide information about atypical observations in data.
(True/False)
4.9/5 (39)
The measures that indicate the location or positions of a value relative to the entire set of data are called the:
(Multiple Choice)
4.8/5 (39)
Suppose you are told that the average return on investment for a particular class of investments was 7.8% with a standard deviation of 2.3.Furthermore,the histogram of the distribution of returns is approximately bell-shaped.We would expect that 95 percent of all of these investments had a return between what two values?
(Multiple Choice)
4.7/5 (37)
For any distribution,the percent of observations that lie within four standard deviations of the mean is:
(Multiple Choice)
4.8/5 (35)
The following subscripted xs represent a sample of size n = 67 which has been ranked from smallest (x1)to largest (x67): x1,x2,x3,…x65,x66,x67.Prepare a 5-number summary for this sample in terms of the subscripted xs.
(Essay)
4.7/5 (33)
Why do we have so many different measures of central tendency? Are all really necessary or do they essentially provide the same information?
(Essay)
4.9/5 (31)
Filters
- Essay(0)
- Multiple Choice(0)
- Short Answer(0)
- True False(0)
- Matching(0)