Exam 2: Describing Data: Numerical
Exam 1: Describing Data: Graphical247 Questions
Exam 2: Describing Data: Numerical326 Questions
Exam 3: Probability345 Questions
Exam 4: Discrete Random Variables and Probability Distributions257 Questions
Exam 5: Continuous Random Variables and Probability Distributions239 Questions
Exam 6: Sampling and Sampling Distributions147 Questions
Exam 7: Estimation: Single Population151 Questions
Exam 8: Estimation: Additional Topics109 Questions
Exam 9: Hypothesis Testing: Single Population164 Questions
Exam 10: Hypothesis Testing: Additional Topics103 Questions
Exam 11: Simple Regression217 Questions
Exam 12: Multiple Regression252 Questions
Exam 13: Additional Topics in Regression Analysis168 Questions
Exam 14: Analysis of Categorical Data241 Questions
Exam 15: Analysis of Variance192 Questions
Exam 16: Time-Series Analysis and Forecasting138 Questions
Exam 17: Additional Topics in Sampling110 Questions
Select questions type
THE NEXT QUESTIONS ARE BASED ON THE FOLLOWING INFORMATION:
The annual percentage returns on two stocks over a 7-year period were as follows:
 -Compare the means of these two population distribution.
(Essay)
4.9/5  (36)
(36)
For a particular sample,the mean is 3.7 and the standard deviation is 1.2.A new sample is formed by adding 6.3 to every item of data in the original sample.Find the mean and standard deviation of the new sample.
(Essay)
4.8/5 (30)
At a highway checkpoint,the average speed of a passing car was measured at 50 miles per hour with a standard deviation of 5 miles per hour.According to Chebyshev's Theorem,what percentage of cars would you expect to be traveling between 42.5 and 57.5 miles per hour?
(Multiple Choice)
4.7/5 (28)
For any data set,the variance is the average of the sum of the squared deviations between each observation and the median.
(True/False)
4.9/5 (35)
Given a set of 25 observations,for what value of the correlation coefficient would we be able to say that there is evidence that a relationship exists between the two variables?
(Multiple Choice)
4.9/5 (32)
If the population variance σ2 is unknown,a sample variance s2 is a better estimator of σ2 if the denominator is s2 formula is (n - 1)rather than n.
(True/False)
4.9/5 (37)
If the interquartile range for a set of data is 10 minutes,this means that the data have a spread of only 10 minutes.
(True/False)
4.9/5 (25)
THE NEXT QUESTIONS ARE BASED ON THE FOLLOWING INFORMATION:
A recent survey asked respondents about their monthly purchases of raffle tickets.The monthly expenditures,in dollars,of ten people who play the raffle are 23,15,11,20,28,35,13,10,20,and 24.
-What can we say about the shape of the distribution of monthly purchases of raffle tickets?
(Multiple Choice)
4.9/5 (41)
THE NEXT QUESTIONS ARE BASED ON THE FOLLOWING INFORMATION:
The police lieutenant in charge of the traffic division reviews the number of traffic citations issued by each of the police officers in his division.He finds that the mean number of citations written by each officer is 23.2 citations per day,with a standard deviation of 3.1.Assume that the distribution of the number of tickets issued is approximately bell-shaped.
-Which of the following statements is true?
(Multiple Choice)
4.9/5 (29)
Calculating GPA,determining average stock recommendations,and approximating the mean of grouped data requires the use of a weighted mean.
(True/False)
4.9/5 (39)
Suppose you are told that the mean of a sample is below the median.What does this information suggest about the distribution?
(Multiple Choice)
4.9/5 (36)
THE NEXT QUESTIONS ARE BASED ON THE FOLLOWING INFORMATION:
Consider the following observations on shear strength of a joint bonded in a particular manner:
 -Determine the value of the sample median.
(Essay)
4.7/5 (29)
Since the interquartile range takes into account only two of the data values,it is susceptible to considerable distortion if there are unusual numbers of extreme observations (outliers).
(True/False)
4.7/5 (27)
The interquartile range measures the spread of the lower 50% of data values.
(True/False)
4.8/5 (34)
Tukey's exploratory data analysis graph which gives information about the shape of the distribution and insight into the spread of the data is called a(n):
(Multiple Choice)
4.8/5 (38)
Suppose you are told that over the past four years,sales have increased at rates of 10%,8%,6%,and 4%.What has been the average annual increase in sales over the past four years?
(Multiple Choice)
4.8/5 (31)
THE NEXT QUESTIONS ARE BASED ON THE FOLLOWING INFORMATION:
The following data represent a sample of 10 scores on a statistics quiz: 16,16,16,16,16,18,18,20,20,and 20.
-The modal score is:
(Multiple Choice)
4.8/5 (34)
THE NEXT QUESTIONS ARE BASED ON THE FOLLOWING INFORMATION:
A sample of 33 students was asked to rate themselves on whether they were outgoing or not using this five point scale: 1 = extremely extroverted,2 = extroverted,3 = neither extroverted nor introverted,4 = introverted,or 5 = extremely introverted.The results are shown in the table below:
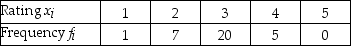 -Calculate the sample mean.
(Essay)
4.8/5 (30)
Suppose you are told that sales this year are 20% higher than they were five years ago.What has been the annual average increase in sales over the past five years?
(Multiple Choice)
4.9/5 (43)
Filters
- Essay(0)
- Multiple Choice(0)
- Short Answer(0)
- True False(0)
- Matching(0)