Exam 2: Describing Data: Numerical
Exam 1: Describing Data: Graphical247 Questions
Exam 2: Describing Data: Numerical326 Questions
Exam 3: Probability345 Questions
Exam 4: Discrete Random Variables and Probability Distributions257 Questions
Exam 5: Continuous Random Variables and Probability Distributions239 Questions
Exam 6: Sampling and Sampling Distributions147 Questions
Exam 7: Estimation: Single Population151 Questions
Exam 8: Estimation: Additional Topics109 Questions
Exam 9: Hypothesis Testing: Single Population164 Questions
Exam 10: Hypothesis Testing: Additional Topics103 Questions
Exam 11: Simple Regression217 Questions
Exam 12: Multiple Regression252 Questions
Exam 13: Additional Topics in Regression Analysis168 Questions
Exam 14: Analysis of Categorical Data241 Questions
Exam 15: Analysis of Variance192 Questions
Exam 16: Time-Series Analysis and Forecasting138 Questions
Exam 17: Additional Topics in Sampling110 Questions
Select questions type
The correlation coefficient measures the strength of a linear relationship between two variables.
(True/False)
4.8/5  (22)
(22)
Calculate the correlation coefficient between the size of the sales force and gross sales.
(Essay)
4.8/5 (23)
In a positively skewed distribution,the mode is greater than the median.
(True/False)
4.9/5 (41)
For any distribution,there are an equal number of observations above and below the mean.
(True/False)
5.0/5 (33)
The first four deviations from the mean in a sample of n = 5 reaction times were .6,.9,1.0,and 1.5.What is the fifth deviation from the mean? Provide a sample for which these are the five deviations from the mean.
(Essay)
4.9/5 (35)
For the following scatter plot,what would be your best estimate of the correlation coefficient? 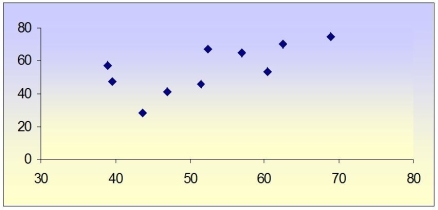
(Multiple Choice)
4.7/5 (34)
For a data set with 10 numerical values arranged in ascending order,the median is the arithmetic mean of the:
(Multiple Choice)
4.8/5 (38)
Suppose you are told that sales this year are 30% higher than they were six years ago.What has been the average annual increase in sales over the past six years?
(Multiple Choice)
4.8/5 (31)
Looking at the scatter plot below,what value would be your best estimate for the correlation coefficient? 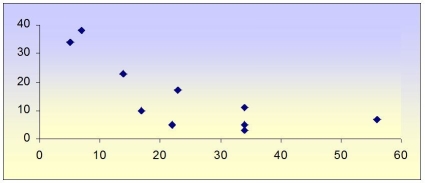
(Multiple Choice)
4.8/5 (41)
The mean is generally the preferred measure of central tendency to describe numerical data,but not categorical data.
(True/False)
4.8/5 (44)
The following ten scores were obtained on a 20-point quiz: 4,5,8,9,11,13,15,18,18,and 20.The teacher computed the usual descriptive measures of center (central tendency)and variability (dispersion)for these data,and then discovered an error was made.One of the 18s should have been a 16.Which of the following measures,calculated on the corrected data,would change from the original computation?
(Multiple Choice)
4.8/5 (35)
In the calculation of the arithmetic mean for grouped data,which value is used to represent all the values in a particular class?
(Multiple Choice)
4.9/5 (36)
The first quartile,Q1,is a number such that at most 25 of the data values are smaller in value than Q1,and at most 75 of the data values are larger.
(True/False)
4.9/5 (33)
For any distribution,the number of values above the mean and below it is the same.
(True/False)
4.9/5 (30)
THE NEXT QUESTIONS ARE BASED ON THE FOLLOWING INFORMATION:
A small accounting office is trying to determine its staffing needs for the coming tax season.The manager has collected the following data: 46,27,79,57,99,75,48,89,and 85.These values represent the number of returns the office completed each year over the entire nine years it has been doing tax returns.
-For this data,what is the coefficient of variation for the number of tax returns completed each year?
(Essay)
4.9/5 (30)
THE NEXT QUESTIONS ARE BASED ON THE FOLLOWING INFORMATION:
A set of data is mounded,with a mean of 500 and a variance of 576.
-Approximately what proportion of the observations is between 428 and 572?
(Essay)
4.8/5 (35)
For which type of distribution is the mean usually less than the median when measuring continuous numerical unimodal data?
(Multiple Choice)
4.9/5 (36)
Filters
- Essay(0)
- Multiple Choice(0)
- Short Answer(0)
- True False(0)
- Matching(0)