Exam 2: Describing Data: Numerical
Exam 1: Describing Data: Graphical247 Questions
Exam 2: Describing Data: Numerical326 Questions
Exam 3: Probability345 Questions
Exam 4: Discrete Random Variables and Probability Distributions257 Questions
Exam 5: Continuous Random Variables and Probability Distributions239 Questions
Exam 6: Sampling and Sampling Distributions147 Questions
Exam 7: Estimation: Single Population151 Questions
Exam 8: Estimation: Additional Topics109 Questions
Exam 9: Hypothesis Testing: Single Population164 Questions
Exam 10: Hypothesis Testing: Additional Topics103 Questions
Exam 11: Simple Regression217 Questions
Exam 12: Multiple Regression252 Questions
Exam 13: Additional Topics in Regression Analysis168 Questions
Exam 14: Analysis of Categorical Data241 Questions
Exam 15: Analysis of Variance192 Questions
Exam 16: Time-Series Analysis and Forecasting138 Questions
Exam 17: Additional Topics in Sampling110 Questions
Select questions type
You may have noticed that each score in sample 2 is obtained by subtracting 4 from the corresponding score in sample 1.Write your conclusion based on the measures of central tendency and variability.
(Essay)
4.8/5  (38)
(38)
To find percentiles and quartiles,data must first be arranged in ascending order.
(True/False)
4.8/5 (39)
THE NEXT QUESTIONS ARE BASED ON THE FOLLOWING INFORMATION:
A researcher is interested in examining how the net wealth of individuals changes over the course of their lifetimes.She has collected the following data regarding the age X,in years,and net worth Y,measured in thousands of dollars,of 12 individuals in the form of (x,y)pairs: (24,153),(34,201),(38,297),(83,139),(77,167),(32,123),(71,247),(49,263),(54,352),(35,321),(65,453),and (30,54).
-Prepare a scatter plot of this data.
(Essay)
4.7/5 (38)
THE NEXT QUESTIONS ARE BASED ON THE FOLLOWING INFORMATION:
A recent survey asked respondents about their monthly purchases of raffle tickets.The monthly expenditures,in dollars,of ten people who play the raffle are 23,15,11,20,28,35,13,10,20,and 24.
-Which of the following statements is not true?
(Multiple Choice)
4.9/5 (32)
THE NEXT QUESTIONS ARE BASED ON THE FOLLOWING INFORMATION:
A recent survey asked respondents about their monthly purchases of raffle tickets.The monthly expenditures,in dollars,of ten people who play the raffle are 23,15,11,20,28,35,13,10,20,and 24.
-Over the past 10 years,the return on Stock A has averaged 8.4% with a standard deviation of 2.1%.The return on Stock B has averaged 3.6% with a standard deviation of 0.9%.Which of the following statements is true?
(Multiple Choice)
4.7/5 (32)
THE NEXT QUESTIONS ARE BASED ON THE FOLLOWING INFORMATION:
Consider the following (x,y)sample data:
(24,24),(19,33),(21,31),(10,36),(22,30),(13,36),(21,32),(23,26),(20,26),and
(21,31).
-Consider the following two sets of data:
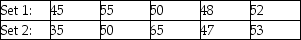 Compare the following measures for both sets:
  ,
,  ,
,  ,and the range.Comment on the meaning of these comparisons.
(Essay)
4.8/5 (39)
THE NEXT QUESTIONS ARE BASED ON THE FOLLOWING INFORMATION:
In a recent survey,12 students at a local university were asked approximately how many hours per week they spend on the Internet.Their responses were: 13,0,5,8,22,7,3,0,15,12,13,and 17.
-What is the coefficient of variation for this data?
(Essay)
4.9/5 (26)
A distribution that has the same shape on either side of the center is said to be symmetrical.
(True/False)
4.8/5 (25)
Determine if there exists a relationship between ice cream sales and temperature.
(Essay)
4.9/5 (33)
THE NEXT QUESTIONS ARE BASED ON THE FOLLOWING INFORMATION:
The police lieutenant in charge of the traffic division has reviewed the number of traffic citations issued per day by each of the 10 police officers in his division.The data were: 13,21,12,34,31,13,22,26,25,and 23.
-What is the mode of the number of citations issued per day?
(Multiple Choice)
4.7/5 (40)
A negatively skewed distribution is not symmetrical.The long tail is to the right.
(True/False)
4.7/5 (37)
The mode is used infrequently in business applications because it:
(Multiple Choice)
4.8/5 (37)
The median value of the data values 12,32,48,8,22,9,30,and 18 equals:
(Multiple Choice)
4.8/5 (40)
Determine if there exists a relationship between the age and net worth of individuals.
(Essay)
4.9/5 (34)
What is the relationship among the mean,median,and mode in a positively skewed distribution?
(Multiple Choice)
4.9/5 (29)
Find the percentage of measurements in the intervals  ± s and
  ± 2s.Compare these results with the Empirical Rule percentages,and comment on the shape of the distribution.
(Essay)
4.9/5 (23)
THE NEXT QUESTIONS ARE BASED ON THE FOLLOWING INFORMATION:
The following data represents the number of minutes an athlete spends training per day.
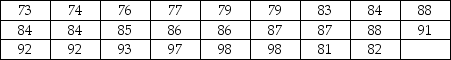 The mean and standard deviation were computed to be 85.54 and 6.97,respectively.The median is 85.5
-What percentage of the measurements actually lie within the interval (71.60,99.48)?
The mean and standard deviation were computed to be 85.54 and 6.97,respectively.The median is 85.5
-What percentage of the measurements actually lie within the interval (71.60,99.48)?
(Essay)
4.9/5 (32)
Filters
- Essay(0)
- Multiple Choice(0)
- Short Answer(0)
- True False(0)
- Matching(0)