Exam 2: Describing Data: Numerical
Exam 1: Describing Data: Graphical247 Questions
Exam 2: Describing Data: Numerical326 Questions
Exam 3: Probability345 Questions
Exam 4: Discrete Random Variables and Probability Distributions257 Questions
Exam 5: Continuous Random Variables and Probability Distributions239 Questions
Exam 6: Sampling and Sampling Distributions147 Questions
Exam 7: Estimation: Single Population151 Questions
Exam 8: Estimation: Additional Topics109 Questions
Exam 9: Hypothesis Testing: Single Population164 Questions
Exam 10: Hypothesis Testing: Additional Topics103 Questions
Exam 11: Simple Regression217 Questions
Exam 12: Multiple Regression252 Questions
Exam 13: Additional Topics in Regression Analysis168 Questions
Exam 14: Analysis of Categorical Data241 Questions
Exam 15: Analysis of Variance192 Questions
Exam 16: Time-Series Analysis and Forecasting138 Questions
Exam 17: Additional Topics in Sampling110 Questions
Select questions type
The median,the second quartile,and the 50th percentile are all the same.
(True/False)
4.8/5  (42)
(42)
Although the range measures the total spread of the data,the interquartile range (IQR)measures only the spread of the middle 50% of the data.
(True/False)
4.8/5 (44)
The interquartile range is the average of the first and third quartiles.
(True/False)
4.8/5 (43)
For the following scatter plot,what would be your best estimate of the correlation coefficient? 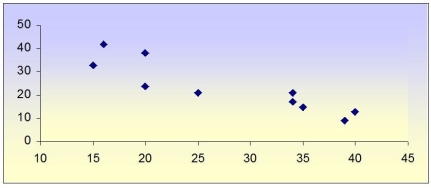
(Multiple Choice)
4.9/5 (38)
Calculate the location of the 25th,50th,and 75th percentile and their values,using the following data:
0 0 5 7 8 9 12 14 22 33
(Essay)
4.8/5 (39)
THE NEXT QUESTIONS ARE BASED ON THE FOLLOWING INFORMATION:
Production records for an automobile manufacturer show the following figures for production per shift (maximum production is 720 cars per shift):
 -Find the median.
(Essay)
4.8/5 (38)
THE NEXT QUESTIONS ARE BASED ON THE FOLLOWING INFORMATION:
An investment councilor recently reviewed the account activity of a sample of 10 of his clients and calculated the average number of stock trades per month over the past year for each client.He obtained the following data values: 10.2,2.5,11.4,3.2,1.1,3.4,8.4,9.7,11.2,and 2.4
-Calculate the average number of trades per month for these 10 clients.
(Essay)
4.9/5 (33)
THE NEXT QUESTIONS ARE BASED ON THE FOLLOWING INFORMATION:
Consider the following (x,y)sample data:
(24,24),(19,33),(21,31),(10,36),(22,30),(13,36),(21,32),(23,26),(20,26),and
(21,31).
-Calculate the variances  and
and  and the covariance sxy.
(Essay)
4.8/5 (37)
Give an example to illustrate that the median should not always be preferred to the mean when the population or sample is skewed.
(Essay)
4.8/5 (47)
THE NEXT QUESTIONS ARE BASED ON THE FOLLOWING INFORMATION:
A set of data is mounded,with a mean of 500 and a variance of 576.
-Approximately what proportion of the observations is between 452 and 548?
(Essay)
4.8/5 (26)
What would you conclude if a sample correlation coefficient is equal to -1.00?
(Multiple Choice)
5.0/5 (29)
THE NEXT QUESTIONS ARE BASED ON THE FOLLOWING INFORMATION:
The following data represent a sample of 10 scores on a statistics quiz: 16,16,16,16,16,18,18,20,20,and 20.
-The median score is:
(Multiple Choice)
4.7/5 (40)
THE NEXT QUESTIONS ARE BASED ON THE FOLLOWING INFORMATION:
A small accounting office is trying to determine its staffing needs for the coming tax season.The manager has collected the following data: 46,27,79,57,99,75,48,89,and 85.These values represent the number of returns the office completed each year over the entire nine years it has been doing tax returns.
-For this data,what is the variance of the number of tax returns completed each year?
(Essay)
4.8/5 (35)
A bored carpenter counts the actual number of nails in 10 boxes of nails and records his findings as: 230,235,302,287,312,323,265,319,342,and 298.What can we say about the shape of the distribution of the number of nails?
(Multiple Choice)
4.8/5 (27)
THE NEXT QUESTIONS ARE BASED ON THE FOLLOWING INFORMATION:
Consider the following (x,y)sample data: (53,37),(34,26),(10,29),(63,55),(28,36),(58,48),(28,41),(50,42),(39,21),and (35,46).
-Calculate the correlation coefficient sample data.
(Essay)
4.9/5 (34)
THE NEXT QUESTIONS ARE BASED ON THE FOLLOWING INFORMATION:
In a recent survey,200 top executives were asked how many hours they spend each year in community service.The data are presented below.
 -Calculate the quantities
  ,
, 
 ,and
,and 
 .
.
(Essay)
4.7/5 (37)
Which of the following statements is true about the correlation coefficient and covariance?
(Multiple Choice)
4.7/5 (38)
The five-number summary refers to the five descriptive measures: minimum,mean,median,mode,and maximum;therefore it is sometimes known as the five-m summary.
(True/False)
4.8/5 (36)
A z-score is a standardized value that indicates the number of standard deviations a value is from the:
(Multiple Choice)
4.9/5 (34)
Based on the values of the mean and median in the previous two questions,are the measurements symmetric or skewed? Why?
(Essay)
4.8/5 (40)
Filters
- Essay(0)
- Multiple Choice(0)
- Short Answer(0)
- True False(0)
- Matching(0)