Exam 8: Aggregate Expenditure and Output in the Short Run
Exam 1: Economics: Foundations and Models148 Questions
Exam 2: Trade-Offs, Comparative Advantage, and the Market System314 Questions
Exam 3: Where Prices Come From: The Interaction of Supply and Demand314 Questions
Exam 4: GDP: Measuring Total Production and Income277 Questions
Exam 5: Unemployment and Inflation300 Questions
Exam 6: Economic Growth, The Financial System, and Business Cycles262 Questions
Exam 7: Long-Run Economic Growth: Sources and Policies280 Questions
Exam 8: Aggregate Expenditure and Output in the Short Run315 Questions
Exam 9: Aggregate Demand and Aggregate Supply Analysis246 Questions
Exam 10: Money, Banks, and the Bank of Canada285 Questions
Exam 11: Monetary Policy281 Questions
Exam 12: Fiscal Policy303 Questions
Exam 13: Inflation, Unemployment, and Bank of Canada Policy265 Questions
Exam 14: Macroeconomics in an Open Economy280 Questions
Exam 15: The International Financial System228 Questions
Select questions type
In 2007-2008, exports from Canada to the United States fell dramatically.Based on the multiplier effect, we would expect
(Multiple Choice)
4.8/5  (34)
(34)
All of the following are one of the four main categories of spending identified by John Maynard Keynes except
(Multiple Choice)
4.9/5 (36)
Table 8.10  -Refer to Table 8.10.Using the table above, calculate the unplanned change in inventories for each level of GDP, and explain what will happen to GDP?
(Essay)
4.7/5 (26)
Use a 45-degree diagram to illustrate macroeconomic equilibrium.Make sure your diagram shows the aggregate expenditure function.Include in your diagram a point where aggregate expenditure is greater than GDP and a point where aggregate expenditure is less than GDP.
(Essay)
4.9/5 (36)
Ceteris paribus, how does an expansion in Canada affect Canadian net exports?
(Essay)
4.8/5 (31)
An increase in the price level in Canada will have what effect on the aggregate expenditure line?
(Multiple Choice)
4.9/5 (32)
C = 3,600 + (MPC)Y
I = 1,200
G = 1,400
NX = -200
If the equilibrium level of GDP is $30,000, using the equations for C, I, G, and NX shown above, find the value of the marginal propensity to consume.
(Essay)
4.9/5 (27)
When net exports equal zero, the economy is in macroeconomic equilibrium.
(True/False)
4.7/5 (36)
The ________ model focuses on the relationship between total spending and real GDP in the short run, assuming the price level is constant.
(Multiple Choice)
4.8/5 (35)
Net exports usually ________ when the Canadian economy is in a recession and ________ when the Canadian economy is expanding, all else equal.
(Multiple Choice)
4.9/5 (43)
An increase in aggregate expenditure has what result on equilibrium GDP?
(Multiple Choice)
4.9/5 (34)
Which of the following is a true statement about the multiplier?
(Multiple Choice)
4.8/5 (36)
An increase in the price level ________ real wealth, which causes consumption to ________.
(Multiple Choice)
4.9/5 (43)
The aggregate demand curve illustrates the relationship between ________ and the ________, holding constant all other factors that affect aggregate expenditure.
(Multiple Choice)
4.9/5 (40)
At each of the three points in the following graph, indicate whether planned aggregate expenditure is greater than, equal to, or less than GDP. 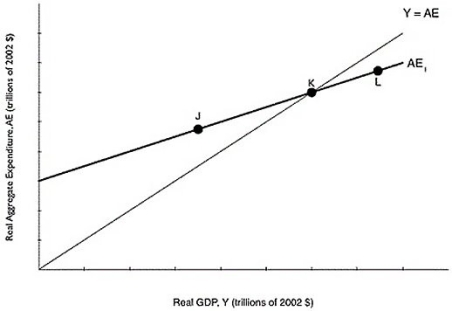 Alt text for Question 47: For question 47, a graph comparing planned aggregate expenditure and GDP.
Long description for Question 47: The x-axis is labelled, real GDP, Y (trillions of 2002 dollars).The y-axis is labelled, real aggregate expenditure, AE (trillions of 2002 dollars).Line Y = AE originates at the vertex and slopes up to the top right corner.Line AE1, begins a little less than half way along the x-axis and slopes up to the end of the x-axis.Both lines intersect at point K, approximately 3 quarters of the way along both lines.Point J is plotted a little less than half way along line AE1, to the left of point K.Point L is plotted close to the right end of line AE1, to the right of point K.
Alt text for Question 47: For question 47, a graph comparing planned aggregate expenditure and GDP.
Long description for Question 47: The x-axis is labelled, real GDP, Y (trillions of 2002 dollars).The y-axis is labelled, real aggregate expenditure, AE (trillions of 2002 dollars).Line Y = AE originates at the vertex and slopes up to the top right corner.Line AE1, begins a little less than half way along the x-axis and slopes up to the end of the x-axis.Both lines intersect at point K, approximately 3 quarters of the way along both lines.Point J is plotted a little less than half way along line AE1, to the left of point K.Point L is plotted close to the right end of line AE1, to the right of point K.
(Essay)
4.9/5 (34)
Filters
- Essay(0)
- Multiple Choice(0)
- Short Answer(0)
- True False(0)
- Matching(0)