Exam 8: Aggregate Expenditure and Output in the Short Run
Exam 1: Economics: Foundations and Models148 Questions
Exam 2: Trade-Offs, Comparative Advantage, and the Market System314 Questions
Exam 3: Where Prices Come From: The Interaction of Supply and Demand314 Questions
Exam 4: GDP: Measuring Total Production and Income277 Questions
Exam 5: Unemployment and Inflation300 Questions
Exam 6: Economic Growth, The Financial System, and Business Cycles262 Questions
Exam 7: Long-Run Economic Growth: Sources and Policies280 Questions
Exam 8: Aggregate Expenditure and Output in the Short Run315 Questions
Exam 9: Aggregate Demand and Aggregate Supply Analysis246 Questions
Exam 10: Money, Banks, and the Bank of Canada285 Questions
Exam 11: Monetary Policy281 Questions
Exam 12: Fiscal Policy303 Questions
Exam 13: Inflation, Unemployment, and Bank of Canada Policy265 Questions
Exam 14: Macroeconomics in an Open Economy280 Questions
Exam 15: The International Financial System228 Questions
Select questions type
What impact does a lower price level have on interest rates, wealth, and investment spending?
(Essay)
4.9/5  (31)
(31)
Which of the following is a reason why increases in the price level result in a decline in aggregate expenditure?
(Multiple Choice)
4.9/5 (41)
If firms find that consumers are purchasing more than expected, which of the following would you expect?
(Multiple Choice)
4.7/5 (33)
Which of the following will cause a direct increase in consumption spending?
(Multiple Choice)
4.8/5 (35)
If consumption is defined as C = 1,350 + 0.6Y, then the marginal propensity to consume is 0.6.
(True/False)
4.7/5 (38)
Figure 8.3  Alt text for Figure 8.3: In figure 8.3, a graph comparing real GDP and real aggregate expenditure.
Long description for Figure 8.3: The x-axis is labelled, real GDP, Y (trillions of 2002 dollars).The y-axis is labelled, real aggregate expenditure, AE (trillions of 2002 dollars).Line Y = AE, originates at the vertex and slopes up to the top right corner.Line AE1, begins a little less than half way along the x-axis and slopes up to the end of the x-axis.Both these lines intersect at point K, approximately 3 quarters of the way along both lines.Point J is plotted a little less than half way along line AE1, to the left of point K.Point L is marked close to the right end of the line AE1, to the right of point K.
-Refer to Figure 8.3.If the economy is in equilibrium, it is at a level of aggregate expenditure given by point
Alt text for Figure 8.3: In figure 8.3, a graph comparing real GDP and real aggregate expenditure.
Long description for Figure 8.3: The x-axis is labelled, real GDP, Y (trillions of 2002 dollars).The y-axis is labelled, real aggregate expenditure, AE (trillions of 2002 dollars).Line Y = AE, originates at the vertex and slopes up to the top right corner.Line AE1, begins a little less than half way along the x-axis and slopes up to the end of the x-axis.Both these lines intersect at point K, approximately 3 quarters of the way along both lines.Point J is plotted a little less than half way along line AE1, to the left of point K.Point L is marked close to the right end of the line AE1, to the right of point K.
-Refer to Figure 8.3.If the economy is in equilibrium, it is at a level of aggregate expenditure given by point
(Multiple Choice)
4.9/5 (41)
Explain how a stock market crash has the potential to lead to a recession in an economy.
(Essay)
4.9/5 (36)
Figure 8.1 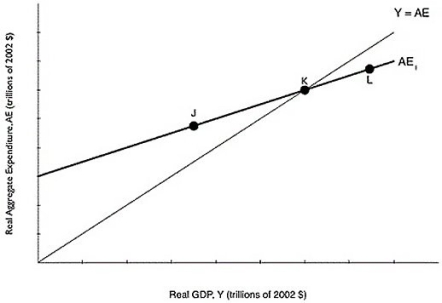 Alt text for Figure 8.1: In figure 8.1, a graph comparing real GDP and real aggregate expenditure.
Long description for Figure 8.1: The x-axis is labelled, real GDP, Y (trillions of 2002 dollars).The y-axis is labelled, real aggregate expenditure, AE (trillions of 2002 dollars).A line, labelled Y = AE, originates at the vertex and slopes up to the top right corner.Another line, labelled AE1, begins a little less than half way along the x-axis and slopes up to the end of the x-axis.Both these lines intersect at point K, approximately three quarters of the way along both lines.Point J is plotted a little less than half way along the line AE1, to the left of point K.Point L is plotted close to the right end of the line AE1, to the right of point K.
-Refer to Figure 8.1.At point L in the figure above, which of the following is true?
Alt text for Figure 8.1: In figure 8.1, a graph comparing real GDP and real aggregate expenditure.
Long description for Figure 8.1: The x-axis is labelled, real GDP, Y (trillions of 2002 dollars).The y-axis is labelled, real aggregate expenditure, AE (trillions of 2002 dollars).A line, labelled Y = AE, originates at the vertex and slopes up to the top right corner.Another line, labelled AE1, begins a little less than half way along the x-axis and slopes up to the end of the x-axis.Both these lines intersect at point K, approximately three quarters of the way along both lines.Point J is plotted a little less than half way along the line AE1, to the left of point K.Point L is plotted close to the right end of the line AE1, to the right of point K.
-Refer to Figure 8.1.At point L in the figure above, which of the following is true?
(Multiple Choice)
4.8/5 (41)
Given Table 8.4 below, fill in the values for saving.Assume there are no taxes.
Table 8.4 
(Essay)
4.8/5 (34)
Consumption spending refers to ________ spending on goods and services.
(Multiple Choice)
4.7/5 (28)
For all points above the 45-degree line, planned aggregate expenditure will be less than GDP.
(True/False)
4.8/5 (19)
Economists think that the marginal propensity to consume for the Canadian economy is somewhere around 0.9.Based on our simple multiplier formula, this would imply that the multiplier for Canada should be around 10.However, economists agree that the government spending multiplier is less than 2.What might explain this supposed anomaly?
(Essay)
4.8/5 (37)
Filters
- Essay(0)
- Multiple Choice(0)
- Short Answer(0)
- True False(0)
- Matching(0)