Exam 8: Aggregate Expenditure and Output in the Short Run
Exam 1: Economics: Foundations and Models148 Questions
Exam 2: Trade-Offs, Comparative Advantage, and the Market System314 Questions
Exam 3: Where Prices Come From: The Interaction of Supply and Demand314 Questions
Exam 4: GDP: Measuring Total Production and Income277 Questions
Exam 5: Unemployment and Inflation300 Questions
Exam 6: Economic Growth, The Financial System, and Business Cycles262 Questions
Exam 7: Long-Run Economic Growth: Sources and Policies280 Questions
Exam 8: Aggregate Expenditure and Output in the Short Run315 Questions
Exam 9: Aggregate Demand and Aggregate Supply Analysis246 Questions
Exam 10: Money, Banks, and the Bank of Canada285 Questions
Exam 11: Monetary Policy281 Questions
Exam 12: Fiscal Policy303 Questions
Exam 13: Inflation, Unemployment, and Bank of Canada Policy265 Questions
Exam 14: Macroeconomics in an Open Economy280 Questions
Exam 15: The International Financial System228 Questions
Select questions type
If firms sell exactly what they expected to sell, all of the following will be true except
(Multiple Choice)
4.8/5  (30)
(30)
If the economy is currently in equilibrium at a level of GDP that is below potential GDP, which of the following would move the economy back to potential GDP?
(Multiple Choice)
4.8/5 (36)
What are the five main determinants of consumption spending? Which of these is the most important?
(Essay)
4.7/5 (41)
Consumption is $5 million, planned investment spending is $8 million, government purchases are $10 million, and net exports are equal to $2 million.If GDP during the same time period is equal to $23 million, what unplanned changes in inventories occurred?
(Multiple Choice)
4.9/5 (45)
An increase in the price level in Canada will shift the aggregate expenditure line upward.
(True/False)
4.8/5 (33)
If an increase in investment spending of $20 million results in a $200 million increase in equilibrium real GDP, then
(Multiple Choice)
4.8/5 (29)
Assume disposable income increases by 10000 and consumption increases by 8500, what is the value of MPC
(Multiple Choice)
4.8/5 (41)
The ratio of the increase in equilibrium real GDP to the increase in autonomous expenditure is called the
(Multiple Choice)
4.9/5 (30)
If disposable income falls by $40 billion and consumption falls by $30 billion, then the slope of the consumption function is
(Multiple Choice)
4.7/5 (28)
Higher interest rates increase both consumption and investment spending.
(True/False)
4.7/5 (31)
Table 8.15  -Refer to Table 8.15.Using the table above, answer the following questions.The numbers in the table are in billions of dollars.
a.What is the equilibrium level of real GDP?
b.What is the MPC?
c.If investment spending declines by $10 billion, what will happen to equilibrium GDP?
-Refer to Table 8.15.Using the table above, answer the following questions.The numbers in the table are in billions of dollars.
a.What is the equilibrium level of real GDP?
b.What is the MPC?
c.If investment spending declines by $10 billion, what will happen to equilibrium GDP?
(Essay)
4.9/5 (41)
Equations for C, I, G, and NX are given below.If the equilibrium level of GDP is $32,000, what will the new equilibrium level of GDP be if government spending increases to 2,000? C = 5,000 + (MPC)Y
I = 1,500
G = 2,000
NX = -500
(Multiple Choice)
4.8/5 (46)
Figure 8.6 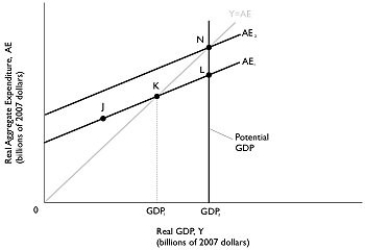 Alt text for Figure 8.6: In figure 8.6, a graph depicting potential GDP.
Long description for Figure 8.6: The x-axis is labelled, real GDP, Y (billions of 2007 dollars), with values GDP1 and GDP2 marked.The y-axis is labelled, real aggregate expenditure, AE (billions of 2007 dollars).Line AE1, begins a little less than half way along the x-axis and slopes up to the end of the x-axis.Line AE2, begins at a point half way along the x-axis and slopes up to the top right corner.Line AE2 is to the left of AE1 and is on a similar path as line AE1.Line Y = AE, originates at the vertex and slopes up to the top right corner.Line Y = AE meets line AE1 at point K, half way along both lines.Line Y = AE meets line AE2 at point N, plotted close to the right end of line AE2.Point J is plotted a little less than half way along line AE1, to the left of point K.Point L is plotted close to the right end of line AE1, to the right of point K.Point K is connected to its x-coordinate, GDP1, with a dotted line.A straight line, representing potential GDP, is drawn joining points N and L with their x-coordinate, GDP2, such that it is parallel to the point K to GDP1 with a dotted line.
-Refer to Figure 8.6.Potential GDP equals $100 billion.The economy is currently producing GDP1 which is equal to $90 billion.If the MPC is 0.8, then how much must autonomous spending change for the economy to move to potential GDP?
Alt text for Figure 8.6: In figure 8.6, a graph depicting potential GDP.
Long description for Figure 8.6: The x-axis is labelled, real GDP, Y (billions of 2007 dollars), with values GDP1 and GDP2 marked.The y-axis is labelled, real aggregate expenditure, AE (billions of 2007 dollars).Line AE1, begins a little less than half way along the x-axis and slopes up to the end of the x-axis.Line AE2, begins at a point half way along the x-axis and slopes up to the top right corner.Line AE2 is to the left of AE1 and is on a similar path as line AE1.Line Y = AE, originates at the vertex and slopes up to the top right corner.Line Y = AE meets line AE1 at point K, half way along both lines.Line Y = AE meets line AE2 at point N, plotted close to the right end of line AE2.Point J is plotted a little less than half way along line AE1, to the left of point K.Point L is plotted close to the right end of line AE1, to the right of point K.Point K is connected to its x-coordinate, GDP1, with a dotted line.A straight line, representing potential GDP, is drawn joining points N and L with their x-coordinate, GDP2, such that it is parallel to the point K to GDP1 with a dotted line.
-Refer to Figure 8.6.Potential GDP equals $100 billion.The economy is currently producing GDP1 which is equal to $90 billion.If the MPC is 0.8, then how much must autonomous spending change for the economy to move to potential GDP?
(Multiple Choice)
4.9/5 (45)
If the consumption function is defined as C = 7,250 + 0.8Y, what is the autonomous level of consumption expenditure?
(Multiple Choice)
4.9/5 (42)
Figure 8.7 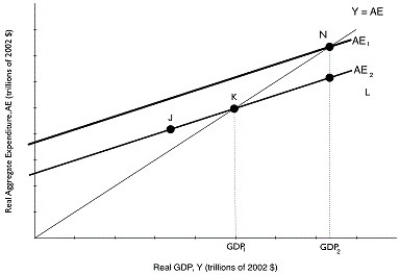 Alt text for Figure 8.7: In figure 8.7, a graph comparing real GDP and real aggregate expenditure.
Long description for Figure 8.7: The x-axis is labelled, real GDP, Y (trillions of 2002 dollars).The y-axis is labelled, real aggregate expenditure, AE (trillions of 2002 dollars).Line AE1, begins a little less than half way along the x-axis and slopes up to the end of the x-axis.Line AE2, is to the right of AE1 and is on a similar path as line AE1, sloping up to the top right corner.Line Y = AE, originates at the vertex and slopes up to the top right corner.Line Y = AE meets line AE2 at point K, half way along both the lines, and meets line AE1 at point N, plotted close to the right end of line AE1.Point J is plotted a little less than half way along line AE2, to the left of point K.Point L is marked close to the right end of line AE2, to the right of point K.
-Refer to Figure 8.7.Suppose that investment spending decreases by $5 million, decreasing aggregate expenditure and decreasing real GDP from GDP2 to GDP1.If the MPC is 0.8, then what is the change in GDP?
Alt text for Figure 8.7: In figure 8.7, a graph comparing real GDP and real aggregate expenditure.
Long description for Figure 8.7: The x-axis is labelled, real GDP, Y (trillions of 2002 dollars).The y-axis is labelled, real aggregate expenditure, AE (trillions of 2002 dollars).Line AE1, begins a little less than half way along the x-axis and slopes up to the end of the x-axis.Line AE2, is to the right of AE1 and is on a similar path as line AE1, sloping up to the top right corner.Line Y = AE, originates at the vertex and slopes up to the top right corner.Line Y = AE meets line AE2 at point K, half way along both the lines, and meets line AE1 at point N, plotted close to the right end of line AE1.Point J is plotted a little less than half way along line AE2, to the left of point K.Point L is marked close to the right end of line AE2, to the right of point K.
-Refer to Figure 8.7.Suppose that investment spending decreases by $5 million, decreasing aggregate expenditure and decreasing real GDP from GDP2 to GDP1.If the MPC is 0.8, then what is the change in GDP?
(Multiple Choice)
4.7/5 (34)
How does a decrease in government spending affect the aggregate expenditure line?
(Multiple Choice)
4.9/5 (33)
Filters
- Essay(0)
- Multiple Choice(0)
- Short Answer(0)
- True False(0)
- Matching(0)