Exam 8: Aggregate Expenditure and Output in the Short Run
Exam 1: Economics: Foundations and Models148 Questions
Exam 2: Trade-Offs, Comparative Advantage, and the Market System314 Questions
Exam 3: Where Prices Come From: The Interaction of Supply and Demand314 Questions
Exam 4: GDP: Measuring Total Production and Income277 Questions
Exam 5: Unemployment and Inflation300 Questions
Exam 6: Economic Growth, The Financial System, and Business Cycles262 Questions
Exam 7: Long-Run Economic Growth: Sources and Policies280 Questions
Exam 8: Aggregate Expenditure and Output in the Short Run315 Questions
Exam 9: Aggregate Demand and Aggregate Supply Analysis246 Questions
Exam 10: Money, Banks, and the Bank of Canada285 Questions
Exam 11: Monetary Policy281 Questions
Exam 12: Fiscal Policy303 Questions
Exam 13: Inflation, Unemployment, and Bank of Canada Policy265 Questions
Exam 14: Macroeconomics in an Open Economy280 Questions
Exam 15: The International Financial System228 Questions
Select questions type
If consumption is defined as C = 4,500 + 0.75Y, then the marginal propensity to save is 0.25.
(True/False)
4.9/5  (34)
(34)
Assume proponents of public funding for a new stadium argue that every dollar spent building the sports and entertainment facility will generate a total of $2.05 in spending in the economy.This indicates that the spending multiplier for the construction industry is equal to
(Multiple Choice)
4.8/5 (41)
Goods that have been produced but not yet sold are referred to as
(Multiple Choice)
4.8/5 (37)
Figure 8.4 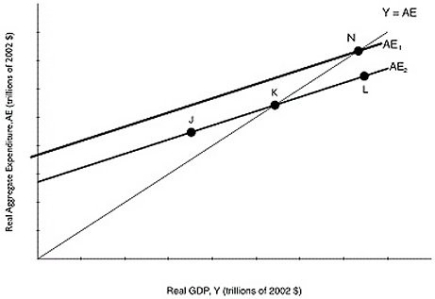 Alt text for Figure 8.4: In figure 8.4, a graph comparing real GDP and real aggregate expenditure.
Long description for Figure 8.4: The x-axis is labelled, real GDP, Y (trillions of 2002 dollars).The y-axis is labelled, real aggregate expenditure, AE (trillions of 2002 dollars).Line AE1, begins a little less than half way along the x-axis and slopes up to the end of the x-axis.Line AE2, begins half way along the x-axis and slopes up to the top right corner.Line AE2 is to the right of line AE1 and is on a similar path as line AE1.Line Y = AE, originates at the vertex and slopes up to the top right corner.Line Y = AE meets line AE2 at point K, half way along both lines.Line Y = AE meets line AE1 at point N, plotted close to the right end of line AE1.Point J is plotted a little less than half way along line AE2, to the left of point K.Point L is marked close to the right end of line AE2, to the right of point K.
-Refer to Figure 8.4.If the Canadian economy is currently at point N, which of the following could cause it to move to point K?
Alt text for Figure 8.4: In figure 8.4, a graph comparing real GDP and real aggregate expenditure.
Long description for Figure 8.4: The x-axis is labelled, real GDP, Y (trillions of 2002 dollars).The y-axis is labelled, real aggregate expenditure, AE (trillions of 2002 dollars).Line AE1, begins a little less than half way along the x-axis and slopes up to the end of the x-axis.Line AE2, begins half way along the x-axis and slopes up to the top right corner.Line AE2 is to the right of line AE1 and is on a similar path as line AE1.Line Y = AE, originates at the vertex and slopes up to the top right corner.Line Y = AE meets line AE2 at point K, half way along both lines.Line Y = AE meets line AE1 at point N, plotted close to the right end of line AE1.Point J is plotted a little less than half way along line AE2, to the left of point K.Point L is marked close to the right end of line AE2, to the right of point K.
-Refer to Figure 8.4.If the Canadian economy is currently at point N, which of the following could cause it to move to point K?
(Multiple Choice)
4.8/5 (32)
Figure 8.3 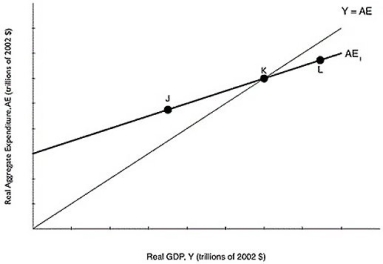 Alt text for Figure 8.3: In figure 8.3, a graph comparing real GDP and real aggregate expenditure.
Long description for Figure 8.3: The x-axis is labelled, real GDP, Y (trillions of 2002 dollars).The y-axis is labelled, real aggregate expenditure, AE (trillions of 2002 dollars).Line Y = AE, originates at the vertex and slopes up to the top right corner.Line AE1, begins a little less than half way along the x-axis and slopes up to the end of the x-axis.Both these lines intersect at point K, approximately 3 quarters of the way along both lines.Point J is plotted a little less than half way along line AE1, to the left of point K.Point L is marked close to the right end of the line AE1, to the right of point K.
-Refer to Figure 8.3.According to the figure above, at what point is aggregate expenditure less than GDP?
Alt text for Figure 8.3: In figure 8.3, a graph comparing real GDP and real aggregate expenditure.
Long description for Figure 8.3: The x-axis is labelled, real GDP, Y (trillions of 2002 dollars).The y-axis is labelled, real aggregate expenditure, AE (trillions of 2002 dollars).Line Y = AE, originates at the vertex and slopes up to the top right corner.Line AE1, begins a little less than half way along the x-axis and slopes up to the end of the x-axis.Both these lines intersect at point K, approximately 3 quarters of the way along both lines.Point J is plotted a little less than half way along line AE1, to the left of point K.Point L is marked close to the right end of the line AE1, to the right of point K.
-Refer to Figure 8.3.According to the figure above, at what point is aggregate expenditure less than GDP?
(Multiple Choice)
4.8/5 (27)
If the consumption function is defined as C = 5,500 + 0.9Y, what is the autonomous level of consumption expenditure?
(Multiple Choice)
4.8/5 (39)
If the multiplier is 5, the marginal propensity to consume must be 0.8.
(True/False)
4.7/5 (42)
The Conference Board of Canada's Consumer Confidence Index measures
(Multiple Choice)
4.8/5 (35)
Autonomous expenditure is a type of expenditure that does not depend on
(Multiple Choice)
4.8/5 (43)
A stock market boom which causes stock prices to rise should cause
(Multiple Choice)
4.9/5 (28)
The equations for C, I, G, and Nx are all given below. What is the equilibrium level of GDP? C = 1252 + 0.7*Y
I = 870
G = 927
NX = 388
(Multiple Choice)
4.7/5 (32)
An increase in the price level in Canada will reduce exports and increase imports.
(True/False)
4.7/5 (40)
Figure 8.2 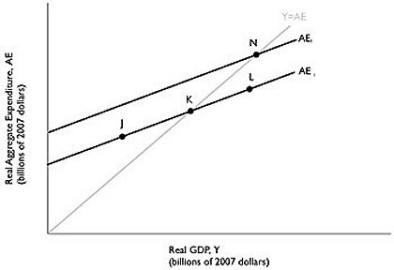 Alt text for Figure 8.2: In figure 8.2, a graph comparing real GDP and real aggregate expenditure.
Long description for Figure 8.2: Line AE1, begins a little less than half way along the x-axis and slopes up toward the end of the x-axis.Line AE2, begins at a point half way on the x-axis and slopes up to the top right corner.Line AE2 is to the left of AE1, and is on a similar path as the line AE1.Line Y = AE, originates at the vertex and slopes upward toward the top right corner.Line Y = AE meets line AE1 at point K, half way along both lines, and meets line AE2 at point N, plotted close to the right end of the line AE2.Point J is plotted a little less than half way along the line AE1, to the left of point K.Another point L is marked close to the right end of line AE1, to the right of point K.
-Refer to Figure 8.2.Suppose that the level of GDP associated with point N is potential GDP.If the Canadian economy is currently at point K,
Alt text for Figure 8.2: In figure 8.2, a graph comparing real GDP and real aggregate expenditure.
Long description for Figure 8.2: Line AE1, begins a little less than half way along the x-axis and slopes up toward the end of the x-axis.Line AE2, begins at a point half way on the x-axis and slopes up to the top right corner.Line AE2 is to the left of AE1, and is on a similar path as the line AE1.Line Y = AE, originates at the vertex and slopes upward toward the top right corner.Line Y = AE meets line AE1 at point K, half way along both lines, and meets line AE2 at point N, plotted close to the right end of the line AE2.Point J is plotted a little less than half way along the line AE1, to the left of point K.Another point L is marked close to the right end of line AE1, to the right of point K.
-Refer to Figure 8.2.Suppose that the level of GDP associated with point N is potential GDP.If the Canadian economy is currently at point K,
(Multiple Choice)
4.8/5 (35)
If planned aggregate expenditure is less than total production,
(Multiple Choice)
4.9/5 (29)
If aggregate expenditure is more than GDP, then inventories fall and GDP rises.
(True/False)
4.8/5 (27)
Given Table 8.5 below, fill in the values for saving.Assume taxes = $800.
Table 8.5 
(Essay)
5.0/5 (33)
Filters
- Essay(0)
- Multiple Choice(0)
- Short Answer(0)
- True False(0)
- Matching(0)