Exam 8: Aggregate Expenditure and Output in the Short Run
Exam 1: Economics: Foundations and Models148 Questions
Exam 2: Trade-Offs, Comparative Advantage, and the Market System314 Questions
Exam 3: Where Prices Come From: The Interaction of Supply and Demand314 Questions
Exam 4: GDP: Measuring Total Production and Income277 Questions
Exam 5: Unemployment and Inflation300 Questions
Exam 6: Economic Growth, The Financial System, and Business Cycles262 Questions
Exam 7: Long-Run Economic Growth: Sources and Policies280 Questions
Exam 8: Aggregate Expenditure and Output in the Short Run315 Questions
Exam 9: Aggregate Demand and Aggregate Supply Analysis246 Questions
Exam 10: Money, Banks, and the Bank of Canada285 Questions
Exam 11: Monetary Policy281 Questions
Exam 12: Fiscal Policy303 Questions
Exam 13: Inflation, Unemployment, and Bank of Canada Policy265 Questions
Exam 14: Macroeconomics in an Open Economy280 Questions
Exam 15: The International Financial System228 Questions
Select questions type
The change in consumption divided by the change in disposable income is equal to
(Multiple Choice)
4.8/5  (41)
(41)
If planned investment is equal to actual investment, then aggregate expenditure is equal to GDP.
(True/False)
4.9/5 (29)
Given the equations for C, I, G, and NX below, what is the equilibrium level of GDP? C = 2,000 + 0.9Y
I = 2,500
G = 3,000
NX = 400
(Multiple Choice)
4.9/5 (44)
All of the following are components of aggregate expenditure except
(Multiple Choice)
4.8/5 (37)
Figure 8.1 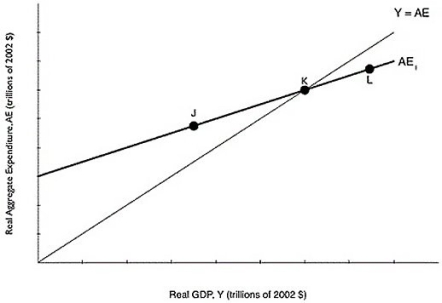 Alt text for Figure 8.1: In figure 8.1, a graph comparing real GDP and real aggregate expenditure.
Long description for Figure 8.1: The x-axis is labelled, real GDP, Y (trillions of 2002 dollars).The y-axis is labelled, real aggregate expenditure, AE (trillions of 2002 dollars).A line, labelled Y = AE, originates at the vertex and slopes up to the top right corner.Another line, labelled AE1, begins a little less than half way along the x-axis and slopes up to the end of the x-axis.Both these lines intersect at point K, approximately three quarters of the way along both lines.Point J is plotted a little less than half way along the line AE1, to the left of point K.Point L is plotted close to the right end of the line AE1, to the right of point K.
-Refer to Figure 8.1.If the economy is at point L, what will happen?
Alt text for Figure 8.1: In figure 8.1, a graph comparing real GDP and real aggregate expenditure.
Long description for Figure 8.1: The x-axis is labelled, real GDP, Y (trillions of 2002 dollars).The y-axis is labelled, real aggregate expenditure, AE (trillions of 2002 dollars).A line, labelled Y = AE, originates at the vertex and slopes up to the top right corner.Another line, labelled AE1, begins a little less than half way along the x-axis and slopes up to the end of the x-axis.Both these lines intersect at point K, approximately three quarters of the way along both lines.Point J is plotted a little less than half way along the line AE1, to the left of point K.Point L is plotted close to the right end of the line AE1, to the right of point K.
-Refer to Figure 8.1.If the economy is at point L, what will happen?
(Multiple Choice)
4.8/5 (35)
If an increase in autonomous consumption spending of $25 million results in a $100 million increase in equilibrium real GDP, then
(Multiple Choice)
4.9/5 (28)
Into which category of aggregate expenditure would each of the following transactions fall?
a.Sandra MacMillian purchases a new Toyota Corolla made in Cambridge, Ontario.
b.The city of Vancouver buys 5 new garbage trucks.
c.Adrian Garcia buys a newly constructed townhome in Winnipeg.
d.An airline in Latvia orders a new airplane from Bombardier.
e.Magna International buys 300 new BlackBerry phones.
(Essay)
4.8/5 (29)
The consumption function describes the relationship between
(Multiple Choice)
4.8/5 (29)
The key idea of the aggregate expenditure model is that in any particular year, the level of GDP is determined mainly by
(Multiple Choice)
4.9/5 (38)
The marginal propensity to consume measures the average amount of wealth that a consumer spends in a given period of time.
(True/False)
4.8/5 (33)
Assume you are given the following information about an economy. C = 1191 NX = -4 G = 450 I = 323
What is the equilibrium value of real GDP?
(Multiple Choice)
4.7/5 (31)
The decrease in consumer spending during the 2008-2009 recession was due in part to falling prices in the stock market.The reason for the decline in consumer spending is most closely related to which of the following variables that determine the level of consumption?
(Multiple Choice)
4.9/5 (38)
________ spending follows a smooth trend whereas, ________ spending is more volatile and subject to fluctuations.
(Multiple Choice)
4.8/5 (34)
As a result of the drop in the oil price and resulting drop in oil production in 2015, many Alberta companies including local Tim Hortons cut production and employment.The total amount of spending in the economy is known as
(Multiple Choice)
4.8/5 (36)
________ is defined as national income + transfers - taxes.
(Multiple Choice)
4.8/5 (36)
Figure 8.8 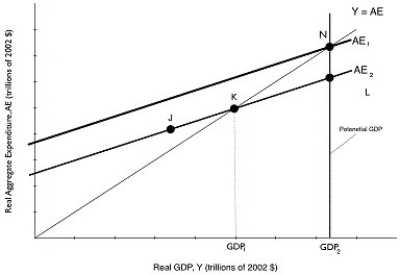 Alt text for Figure 8.8: In figure 8.8, a graph depicting potential GDP.
Long description for Figure 8.8: The x-axis is labelled, real GDP, Y (trillions of 2002 dollars)with values GDP1 and GDP2 marked.The y-axis is labelled, real aggregate expenditure, AE (trillions of 2002 dollars).Line AE1, begins a little less than half way on the x-axis and slopes up to the end of the x-axis.Line AE2, is to the right of AE1 and is on a similar path, sloping up to the top right corner.Line Y = AE, originates at the vertex and slopes up to the top right corner.Line Y = AE intersects line AE2 at point K, half way along both lines, and intersects line AE1 at point N, plotted close to the right end of line AE1.Point J is plotted a little less than half way along line AE2, to the left of point K.Point L is plotted close to the right end of line AE2, to the right of point K.Point K is connected to its x-coordinate, GDP1, with a dotted line.A straight line, representing potential GDP, is drawn connecting points N and L with their x-coordinate, GDP2, such that it is parallel to line connecting point K with value GDP1.
-Refer to Figure 8.8.Potential GDP equals $500 billion.The economy is currently producing GDP1, which is equal to $450 billion.If the MPC is 0.8, then how much must autonomous spending change for the economy to move to potential GDP?
Alt text for Figure 8.8: In figure 8.8, a graph depicting potential GDP.
Long description for Figure 8.8: The x-axis is labelled, real GDP, Y (trillions of 2002 dollars)with values GDP1 and GDP2 marked.The y-axis is labelled, real aggregate expenditure, AE (trillions of 2002 dollars).Line AE1, begins a little less than half way on the x-axis and slopes up to the end of the x-axis.Line AE2, is to the right of AE1 and is on a similar path, sloping up to the top right corner.Line Y = AE, originates at the vertex and slopes up to the top right corner.Line Y = AE intersects line AE2 at point K, half way along both lines, and intersects line AE1 at point N, plotted close to the right end of line AE1.Point J is plotted a little less than half way along line AE2, to the left of point K.Point L is plotted close to the right end of line AE2, to the right of point K.Point K is connected to its x-coordinate, GDP1, with a dotted line.A straight line, representing potential GDP, is drawn connecting points N and L with their x-coordinate, GDP2, such that it is parallel to line connecting point K with value GDP1.
-Refer to Figure 8.8.Potential GDP equals $500 billion.The economy is currently producing GDP1, which is equal to $450 billion.If the MPC is 0.8, then how much must autonomous spending change for the economy to move to potential GDP?
(Multiple Choice)
4.9/5 (38)
If the marginal propensity to save is 0.4, the multiplier is 2.5.
(True/False)
4.8/5 (37)
________ consumption is consumption that depends upon the level of GDP, and ________ consumption is consumption that does not depend upon the level of GDP.
(Multiple Choice)
4.8/5 (47)
Filters
- Essay(0)
- Multiple Choice(0)
- Short Answer(0)
- True False(0)
- Matching(0)