Exam 8: Aggregate Expenditure and Output in the Short Run
Exam 1: Economics: Foundations and Models148 Questions
Exam 2: Trade-Offs, Comparative Advantage, and the Market System314 Questions
Exam 3: Where Prices Come From: The Interaction of Supply and Demand314 Questions
Exam 4: GDP: Measuring Total Production and Income277 Questions
Exam 5: Unemployment and Inflation300 Questions
Exam 6: Economic Growth, The Financial System, and Business Cycles262 Questions
Exam 7: Long-Run Economic Growth: Sources and Policies280 Questions
Exam 8: Aggregate Expenditure and Output in the Short Run315 Questions
Exam 9: Aggregate Demand and Aggregate Supply Analysis246 Questions
Exam 10: Money, Banks, and the Bank of Canada285 Questions
Exam 11: Monetary Policy281 Questions
Exam 12: Fiscal Policy303 Questions
Exam 13: Inflation, Unemployment, and Bank of Canada Policy265 Questions
Exam 14: Macroeconomics in an Open Economy280 Questions
Exam 15: The International Financial System228 Questions
Select questions type
Given Table 8.9 below, fill in the values of the marginal propensity to save (MPS)and the marginal propensity to consume (MPC).Show that MPC + MPS = 1.
Table 8.9 
(Essay)
4.9/5  (35)
(35)
Consumption spending is $5 million, planned investment spending is $8 million, actual investment spending is $8 million, government purchases are $10 million, and net export spending is $2 million. Based on this information, which of the following is true?
(Multiple Choice)
4.9/5 (36)
John Maynard Keynes argued that if many households decide at the same time to increase saving and reduce spending,
(Multiple Choice)
4.9/5 (43)
A decrease in ________ can put your job at risk if aggregate expenditures fall.
(Multiple Choice)
4.8/5 (36)
Figure 8.2 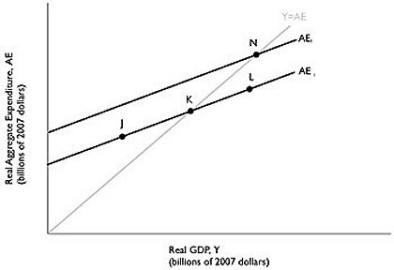 Alt text for Figure 8.2: In figure 8.2, a graph comparing real GDP and real aggregate expenditure.
Long description for Figure 8.2: Line AE1, begins a little less than half way along the x-axis and slopes up toward the end of the x-axis.Line AE2, begins at a point half way on the x-axis and slopes up to the top right corner.Line AE2 is to the left of AE1, and is on a similar path as the line AE1.Line Y = AE, originates at the vertex and slopes upward toward the top right corner.Line Y = AE meets line AE1 at point K, half way along both lines, and meets line AE2 at point N, plotted close to the right end of the line AE2.Point J is plotted a little less than half way along the line AE1, to the left of point K.Another point L is marked close to the right end of line AE1, to the right of point K.
-Refer to Figure 8.2.If the Canadian economy is currently at point N, which of the following could cause it to move to point K?
Alt text for Figure 8.2: In figure 8.2, a graph comparing real GDP and real aggregate expenditure.
Long description for Figure 8.2: Line AE1, begins a little less than half way along the x-axis and slopes up toward the end of the x-axis.Line AE2, begins at a point half way on the x-axis and slopes up to the top right corner.Line AE2 is to the left of AE1, and is on a similar path as the line AE1.Line Y = AE, originates at the vertex and slopes upward toward the top right corner.Line Y = AE meets line AE1 at point K, half way along both lines, and meets line AE2 at point N, plotted close to the right end of the line AE2.Point J is plotted a little less than half way along the line AE1, to the left of point K.Another point L is marked close to the right end of line AE1, to the right of point K.
-Refer to Figure 8.2.If the Canadian economy is currently at point N, which of the following could cause it to move to point K?
(Multiple Choice)
4.8/5 (34)
If the consumption function is defined as C = 5,500 + 0.9Y, what is the multiplier?
(Multiple Choice)
4.8/5 (30)
A stock market crash that causes stock prices to fall should cause
(Multiple Choice)
4.8/5 (38)
C = 4,000 + 0.5Y
I = 1,500
G = 2,250
NX = -150
Given the equations for C, I, G, and NX above, what is the equilibrium level of GDP (Y)?
(Essay)
4.9/5 (38)
A rising price level decreases consumption by decreasing the real value of household wealth.
(True/False)
4.9/5 (48)
If disposable income falls by $50 billion and consumption falls by $40 billion, then the slope of the consumption function is
(Multiple Choice)
4.8/5 (32)
Which of the following is most likely to decrease due to a recession?
(Multiple Choice)
4.8/5 (34)
Which of the following is a reason why decreases in the price level result in a rise in aggregate expenditure?
(Multiple Choice)
4.8/5 (29)
Economists first began studying the relationship between changes in aggregate expenditures and changes in GDP
(Multiple Choice)
5.0/5 (27)
At macroeconomic equilibrium, total ________ equals total ________.
(Multiple Choice)
4.9/5 (34)
Following recession, slow economic growth, and increasing gas prices, Tim Hortons sales were lower than expected.If a decrease in restaurant sales decreases aggregate expenditure, then
(Multiple Choice)
5.0/5 (28)
Table 8.3  -Refer to Table 8.3.Given the consumption schedule in the table above, the marginal propensity to save is
(Multiple Choice)
4.9/5 (30)
The five most important variables that determine the level of ________ are disposable income, wealth, expected future income, price level, and interest rate.
(Multiple Choice)
4.7/5 (31)
A decrease in the price level results in a(n)________ in household consumption spending and a(n)________ in investment spending.
(Multiple Choice)
4.9/5 (40)
C = 2,800 + 0.9Y
I = 750
G = 1,200
NX = 150
Given the equations for C, I, G, and NX above, what is the equilibrium level of GDP (Y)?
(Essay)
4.8/5 (25)
Filters
- Essay(0)
- Multiple Choice(0)
- Short Answer(0)
- True False(0)
- Matching(0)