Exam 8: Aggregate Expenditure and Output in the Short Run
Exam 1: Economics: Foundations and Models148 Questions
Exam 2: Trade-Offs, Comparative Advantage, and the Market System314 Questions
Exam 3: Where Prices Come From: The Interaction of Supply and Demand314 Questions
Exam 4: GDP: Measuring Total Production and Income277 Questions
Exam 5: Unemployment and Inflation300 Questions
Exam 6: Economic Growth, The Financial System, and Business Cycles262 Questions
Exam 7: Long-Run Economic Growth: Sources and Policies280 Questions
Exam 8: Aggregate Expenditure and Output in the Short Run315 Questions
Exam 9: Aggregate Demand and Aggregate Supply Analysis246 Questions
Exam 10: Money, Banks, and the Bank of Canada285 Questions
Exam 11: Monetary Policy281 Questions
Exam 12: Fiscal Policy303 Questions
Exam 13: Inflation, Unemployment, and Bank of Canada Policy265 Questions
Exam 14: Macroeconomics in an Open Economy280 Questions
Exam 15: The International Financial System228 Questions
Select questions type
Discuss the leading causes of the Great Depression.Use the 45-degree line diagram to show how they caused a decline in GDP.
(Essay)
4.8/5  (33)
(33)
When aggregate expenditure is more than GDP, which of the following is true?
(Multiple Choice)
4.9/5 (27)
If the MPC is 0.5, then a $10 million increase in disposable income will increase consumption by
(Multiple Choice)
4.9/5 (32)
If consumption is defined as C = 2,400 + 0.9Y, then the marginal propensity to consume is 0.9.
(True/False)
4.8/5 (30)
Assume that inventories declined by more than analysts predicted.This implies that
(Multiple Choice)
4.7/5 (38)
Examples of assets that are included in ________ would be stocks, bonds, and savings accounts.
(Multiple Choice)
5.0/5 (44)
If planned aggregate expenditure is less than total production,
(Multiple Choice)
4.9/5 (33)
In a small economy in 2017, aggregate expenditure was $800 million while GDP that year was $850 million.Which of the following can explain the difference between aggregate expenditure and GDP that year?
(Multiple Choice)
4.9/5 (39)
On the 45-degree line diagram, for points that lie above the 45-degree line,
(Multiple Choice)
4.8/5 (33)
Consumption is $5 billion, planned investment spending is $8 billion, government purchases are $10 billion, and net exports are equal to $2 billion.If GDP during that same time period is equal to $27 billion, what unplanned changes in inventories occurred?
(Multiple Choice)
4.9/5 (33)
If the consumption function is defined as C = 7,250 + 0.8Y, what is the multiplier?
(Multiple Choice)
4.9/5 (23)
Investment spending increases during ________, and decreases during ________.
(Multiple Choice)
4.9/5 (31)
Figure 8.3 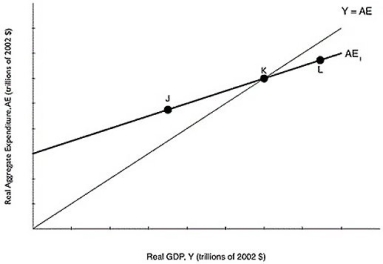 Alt text for Figure 8.3: In figure 8.3, a graph comparing real GDP and real aggregate expenditure.
Long description for Figure 8.3: The x-axis is labelled, real GDP, Y (trillions of 2002 dollars).The y-axis is labelled, real aggregate expenditure, AE (trillions of 2002 dollars).Line Y = AE, originates at the vertex and slopes up to the top right corner.Line AE1, begins a little less than half way along the x-axis and slopes up to the end of the x-axis.Both these lines intersect at point K, approximately 3 quarters of the way along both lines.Point J is plotted a little less than half way along line AE1, to the left of point K.Point L is marked close to the right end of the line AE1, to the right of point K.
-Refer to Figure 8.3.At point J in the figure above, which of the following is true?
Alt text for Figure 8.3: In figure 8.3, a graph comparing real GDP and real aggregate expenditure.
Long description for Figure 8.3: The x-axis is labelled, real GDP, Y (trillions of 2002 dollars).The y-axis is labelled, real aggregate expenditure, AE (trillions of 2002 dollars).Line Y = AE, originates at the vertex and slopes up to the top right corner.Line AE1, begins a little less than half way along the x-axis and slopes up to the end of the x-axis.Both these lines intersect at point K, approximately 3 quarters of the way along both lines.Point J is plotted a little less than half way along line AE1, to the left of point K.Point L is marked close to the right end of the line AE1, to the right of point K.
-Refer to Figure 8.3.At point J in the figure above, which of the following is true?
(Multiple Choice)
4.8/5 (31)
Table 8.7  -Refer to Table 8.7.Given the consumption schedule in the table above, the marginal propensity to consume is
(Multiple Choice)
4.9/5 (34)
If planned investment is greater than actual investment, then aggregate expenditure is less than GDP.
(True/False)
4.8/5 (34)
Given Table 8.6 below, fill in the values of the marginal propensity to save (MPS)and the marginal propensity to consume (MPC).Show that MPC + MPS = 1.
Table 8.6 
(Essay)
4.7/5 (38)
If the MPC is 0.95, then a $10 million increase in disposable income will
(Multiple Choice)
4.8/5 (30)
In the aggregate expenditure model, ________ has both an autonomous component and an induced component.
(Multiple Choice)
4.8/5 (33)
As a result of the oil price, revenues at many ________Tim Hortons locations ________, and it ________ the size of its workforce.
(Multiple Choice)
4.8/5 (45)
Filters
- Essay(0)
- Multiple Choice(0)
- Short Answer(0)
- True False(0)
- Matching(0)