Exam 8: Aggregate Expenditure and Output in the Short Run
Exam 1: Economics: Foundations and Models148 Questions
Exam 2: Trade-Offs, Comparative Advantage, and the Market System314 Questions
Exam 3: Where Prices Come From: The Interaction of Supply and Demand314 Questions
Exam 4: GDP: Measuring Total Production and Income277 Questions
Exam 5: Unemployment and Inflation300 Questions
Exam 6: Economic Growth, The Financial System, and Business Cycles262 Questions
Exam 7: Long-Run Economic Growth: Sources and Policies280 Questions
Exam 8: Aggregate Expenditure and Output in the Short Run315 Questions
Exam 9: Aggregate Demand and Aggregate Supply Analysis246 Questions
Exam 10: Money, Banks, and the Bank of Canada285 Questions
Exam 11: Monetary Policy281 Questions
Exam 12: Fiscal Policy303 Questions
Exam 13: Inflation, Unemployment, and Bank of Canada Policy265 Questions
Exam 14: Macroeconomics in an Open Economy280 Questions
Exam 15: The International Financial System228 Questions
Select questions type
Figure 8.1 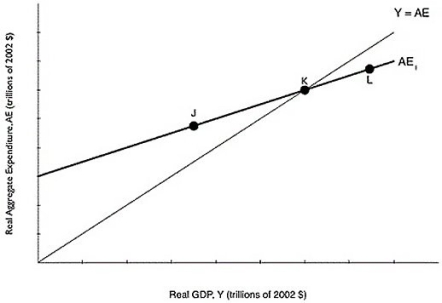 Alt text for Figure 8.1: In figure 8.1, a graph comparing real GDP and real aggregate expenditure.
Long description for Figure 8.1: The x-axis is labelled, real GDP, Y (trillions of 2002 dollars).The y-axis is labelled, real aggregate expenditure, AE (trillions of 2002 dollars).A line, labelled Y = AE, originates at the vertex and slopes up to the top right corner.Another line, labelled AE1, begins a little less than half way along the x-axis and slopes up to the end of the x-axis.Both these lines intersect at point K, approximately three quarters of the way along both lines.Point J is plotted a little less than half way along the line AE1, to the left of point K.Point L is plotted close to the right end of the line AE1, to the right of point K.
-Refer to Figure 8.1.If the economy is at a level of aggregate expenditure given by point K,
Alt text for Figure 8.1: In figure 8.1, a graph comparing real GDP and real aggregate expenditure.
Long description for Figure 8.1: The x-axis is labelled, real GDP, Y (trillions of 2002 dollars).The y-axis is labelled, real aggregate expenditure, AE (trillions of 2002 dollars).A line, labelled Y = AE, originates at the vertex and slopes up to the top right corner.Another line, labelled AE1, begins a little less than half way along the x-axis and slopes up to the end of the x-axis.Both these lines intersect at point K, approximately three quarters of the way along both lines.Point J is plotted a little less than half way along the line AE1, to the left of point K.Point L is plotted close to the right end of the line AE1, to the right of point K.
-Refer to Figure 8.1.If the economy is at a level of aggregate expenditure given by point K,
(Multiple Choice)
4.7/5  (35)
(35)
In a small economy in 2016, aggregate expenditure was $850 million while GDP that year was $800 million.Which of the following can explain the difference between aggregate expenditure and GDP that year?
(Multiple Choice)
4.7/5 (37)
Consumer spending ________ and investment spending ________.
(Multiple Choice)
4.8/5 (35)
Consumption spending is $5 million, planned investment spending is $8 million, unplanned investment spending is $2 million, government purchases are $10 million, and net export spending is $2 million.What is GDP?
(Multiple Choice)
4.8/5 (34)
The five most important variables that determine the level of consumption are
(Multiple Choice)
4.9/5 (23)
Given Table 8.8 below, fill in the values for saving.Assume there are no taxes.
Table 8.8 
(Essay)
4.8/5 (28)
For all points below the 45-degree line, planned aggregate expenditure will be less than GDP.
(True/False)
4.9/5 (39)
Consumption spending will ________ when disposable income ________.
(Multiple Choice)
4.9/5 (33)
John Maynard Keynes argued that if many households decide at the same time to increase saving and reduce spending,
(Multiple Choice)
4.8/5 (34)
The sum of the marginal propensity to consume and the marginal propensity to save is always equal to
(Multiple Choice)
4.7/5 (40)
The aggregate demand curve shows the relationship between the price level and the level of planned aggregate expenditure in the economy.
(True/False)
4.8/5 (29)
If national income increases by $75 million and consumption increases by $15 million, the marginal propensity to consume is
(Multiple Choice)
4.9/5 (34)
Table 8.2  -Refer to Table 8.2.Using the table above, compute aggregate expenditure and identify the macroeconomic equilibrium.
(Essay)
4.8/5 (28)
An increase in the price level results in a(n)________ in household consumption spending and a(n)________ in investment spending.
(Multiple Choice)
4.8/5 (39)
Firms in a small economy anticipated that inventories would grow over the past year by $750,000, and over that year, inventories grew by exactly $750,000.This implies that
(Multiple Choice)
4.8/5 (34)
If the marginal propensity to save is 0.25, then a $10,000 decrease in disposable income will
(Multiple Choice)
4.8/5 (33)
Would a larger multiplier lead to longer and more severe recessions or shorter and less severe recessions? Briefly explain.
(Essay)
4.8/5 (33)
When Javier's income increases by $5,000, he spends an additional $3,750 dollars.This implies that his marginal propensity to consume is 0.75.
(True/False)
4.7/5 (39)
Filters
- Essay(0)
- Multiple Choice(0)
- Short Answer(0)
- True False(0)
- Matching(0)