Exam 8: Aggregate Expenditure and Output in the Short Run
Exam 1: Economics: Foundations and Models148 Questions
Exam 2: Trade-Offs, Comparative Advantage, and the Market System314 Questions
Exam 3: Where Prices Come From: The Interaction of Supply and Demand314 Questions
Exam 4: GDP: Measuring Total Production and Income277 Questions
Exam 5: Unemployment and Inflation300 Questions
Exam 6: Economic Growth, The Financial System, and Business Cycles262 Questions
Exam 7: Long-Run Economic Growth: Sources and Policies280 Questions
Exam 8: Aggregate Expenditure and Output in the Short Run315 Questions
Exam 9: Aggregate Demand and Aggregate Supply Analysis246 Questions
Exam 10: Money, Banks, and the Bank of Canada285 Questions
Exam 11: Monetary Policy281 Questions
Exam 12: Fiscal Policy303 Questions
Exam 13: Inflation, Unemployment, and Bank of Canada Policy265 Questions
Exam 14: Macroeconomics in an Open Economy280 Questions
Exam 15: The International Financial System228 Questions
Select questions type
If inflation in Canada is lower than inflation in other countries, what will be the effect on net exports for Canada?
(Multiple Choice)
4.8/5  (34)
(34)
Consumption spending is $5 million, planned investment spending is $8 million, unplanned investment spending is -$2 million, government purchases are $10 million, and net export spending is $2 million. What is GDP?
(Multiple Choice)
4.8/5 (39)
C = 2,550 + (MPC)Y
I = 800
G = 1,100
NX = 50
If the equilibrium level of GDP is $11,250, using the equations for C, I, G, and NX shown above, find the value of the marginal propensity to consume.
(Essay)
4.9/5 (34)
If the consumption function is defined as C = 7,250 + 0.8Y, what is the value of the multiplier?
(Multiple Choice)
4.9/5 (42)
A/an ________ in taxes will decrease consumption spending, and a/an________ in transfer payments will increase consumption spending.
(Multiple Choice)
4.8/5 (35)
When Jack's income increases by $1,000, he spends an additional $850 dollars.This implies that his marginal propensity to save is 0.85.
(True/False)
4.9/5 (31)
Actual investment spending includes spending by consumers on
(Multiple Choice)
4.9/5 (37)
The ratio of the increase in ________ to the increase in ________ is called the multiplier.
(Multiple Choice)
4.9/5 (48)
What impact does an increase in the price level in Canada have on net exports and why?
(Multiple Choice)
4.8/5 (28)
Figure 8.7 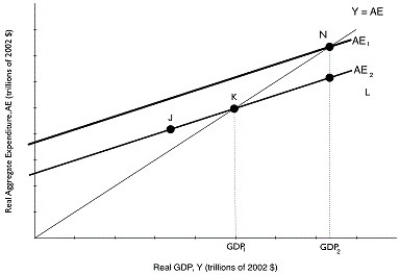 Alt text for Figure 8.7: In figure 8.7, a graph comparing real GDP and real aggregate expenditure.
Long description for Figure 8.7: The x-axis is labelled, real GDP, Y (trillions of 2002 dollars).The y-axis is labelled, real aggregate expenditure, AE (trillions of 2002 dollars).Line AE1, begins a little less than half way along the x-axis and slopes up to the end of the x-axis.Line AE2, is to the right of AE1 and is on a similar path as line AE1, sloping up to the top right corner.Line Y = AE, originates at the vertex and slopes up to the top right corner.Line Y = AE meets line AE2 at point K, half way along both the lines, and meets line AE1 at point N, plotted close to the right end of line AE1.Point J is plotted a little less than half way along line AE2, to the left of point K.Point L is marked close to the right end of line AE2, to the right of point K.
-Refer to Figure 8.7.Suppose that government spending increases, shifting up the aggregate expenditure line.GDP increases from GDP1 to GDP2, and this amount is $200 billion.If the MPC is 0.8, then what is the distance between N and L, or by how much did government spending change?
Alt text for Figure 8.7: In figure 8.7, a graph comparing real GDP and real aggregate expenditure.
Long description for Figure 8.7: The x-axis is labelled, real GDP, Y (trillions of 2002 dollars).The y-axis is labelled, real aggregate expenditure, AE (trillions of 2002 dollars).Line AE1, begins a little less than half way along the x-axis and slopes up to the end of the x-axis.Line AE2, is to the right of AE1 and is on a similar path as line AE1, sloping up to the top right corner.Line Y = AE, originates at the vertex and slopes up to the top right corner.Line Y = AE meets line AE2 at point K, half way along both the lines, and meets line AE1 at point N, plotted close to the right end of line AE1.Point J is plotted a little less than half way along line AE2, to the left of point K.Point L is marked close to the right end of line AE2, to the right of point K.
-Refer to Figure 8.7.Suppose that government spending increases, shifting up the aggregate expenditure line.GDP increases from GDP1 to GDP2, and this amount is $200 billion.If the MPC is 0.8, then what is the distance between N and L, or by how much did government spending change?
(Multiple Choice)
4.9/5 (39)
A decrease in the price level in Canada will shift the aggregate expenditure line downward.
(True/False)
4.8/5 (32)
If the marginal propensity to consume is 0.75, the marginal propensity to save is
(Multiple Choice)
4.9/5 (38)
An increase in the price level in Canada will reduce imports and increase exports.
(True/False)
4.9/5 (39)
In the aftermath of the 2008-2009 recession, snowmobile purchases
(Multiple Choice)
4.8/5 (37)
If the consumption function is defined as C = 7,250 + 0.8Y, what is the marginal propensity to save?
(Multiple Choice)
4.8/5 (34)
Firms in a small economy anticipated that inventories would grow over the past year by $500,000.Over that year, inventories actually grew by only $400,000.This implies that
(Multiple Choice)
4.8/5 (38)
If disposable income increases by $500 million, and consumption increases by $400 million, then the marginal propensity to consume is
(Multiple Choice)
4.8/5 (37)
Equations for C, I, G, and NX are given below.If the equilibrium level of GDP is $32,000, what is the marginal propensity to consume? C = 5,000 + (MPC)Y
I = 1,500
G = 2,000
NX = -500
(Multiple Choice)
4.8/5 (30)
Filters
- Essay(0)
- Multiple Choice(0)
- Short Answer(0)
- True False(0)
- Matching(0)