Exam 10: A: Statistical Quality Control
Exam 1: Introduction to Operations Management63 Questions
Exam 2: Competitiveness, Strategic Planning, and Productivity54 Questions
Exam 3: Demand Forecasting172 Questions
Exam 4: A: Product Design74 Questions
Exam 4: B: Product Design56 Questions
Exam 5: A: Strategic Capacity Planning74 Questions
Exam 5: B: Strategic Capacity Planning64 Questions
Exam 6: A: Process Design and Facility Layout157 Questions
Exam 6: B: Process Design and Facility Layout99 Questions
Exam 7: A: Design of Work Systems143 Questions
Exam 7: B: Design of Work Systems68 Questions
Exam 8: A: Location Planning and Analysis74 Questions
Exam 8: B: Location Planning and Analysis16 Questions
Exam 9: Management of Quality98 Questions
Exam 10: A: Statistical Quality Control121 Questions
Exam 10: B: Statistical Quality Control61 Questions
Exam 11: Supply Chain Management86 Questions
Exam 12: Inventory Management168 Questions
Exam 13: Aggregate Operations Planning71 Questions
Exam 14: Material Requirements Planning and Enterprise Resource Planning84 Questions
Exam 15: A: Just-In-Time and Lean Production82 Questions
Exam 15: B: Just-In-Time and Lean Production32 Questions
Exam 16: Job and Staff Scheduling112 Questions
Exam 17: Project Management127 Questions
Exam 18: A: Waiting-Line Analysis76 Questions
Exam 18: B: Waiting-Line Analysis41 Questions
Select questions type
What is the estimate of the mean proportion of failures,(p̅)for these instructors?
(Multiple Choice)
4.9/5  (42)
(42)
Typically the production of high-cost,low-volume items require little quality control inspection.
(True/False)
4.8/5 (38)
Given the following process control data for a quality attribute (three samples of size 400 each):
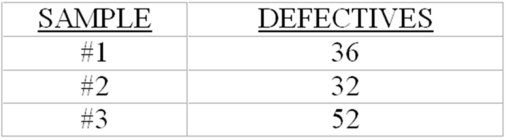 -If the process is known to produce 11 percent defectives on average,what is the alpha risk (probability of Type I error)for upper and lower control limits of .1256 and .0944 respectively?
.1412 and .0788?
.1568 and .0632?
-If the process is known to produce 11 percent defectives on average,what is the alpha risk (probability of Type I error)for upper and lower control limits of .1256 and .0944 respectively?
.1412 and .0788?
.1568 and .0632?
(Short Answer)
4.9/5 (31)
What is the standard deviation of the sampling distribution of sample means?
(Multiple Choice)
4.9/5 (45)
Construct the appropriate control chart for the sample observations listed below,and determine if the process is in control using two sigma limits.

(Essay)
4.9/5 (38)
Given the following process control data for a normally distributed quality variable (three samples of size four each):
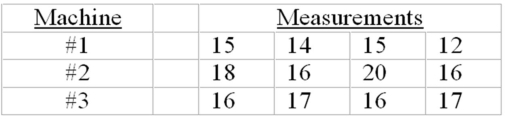 -If the process is known to have a mean of 15 and a standard deviation of 3,using three sigma control limits,do any of the sample means indicate an out-of-control process mean?
(Short Answer)
4.7/5 (32)
"Process capability" compares "process variability" to the "design specifications".
(True/False)
4.8/5 (42)
What is the estimate of the standard deviation of the sampling distribution for an instructor's sample proportion of failures?
(Multiple Choice)
4.9/5 (36)
The amount of inspection can range from no inspection at all to inspecting each item numerous times.
(True/False)
4.8/5 (43)
If he uses upper and lower control limits of 520 and 480 hours,what is his risk (alpha)of concluding service life is out of control when it is actually under control (Type I error)?
(Multiple Choice)
4.9/5 (38)
Using .95 control limits,(5% alpha risk),which instructor(s),if any,should he conclude is (are)out of control?
(Multiple Choice)
4.8/5 (40)
When a process is not centred,its capability should be based on Cpk because it considers the upper and lower design specifications separately and not just the overall design specification width.
(True/False)
4.9/5 (43)
The frequency and quantity of inspection depends primarily on the cost of inspection.
(True/False)
4.9/5 (34)
A control chart used to monitor the fraction of defectives generated by a process is the:
(Multiple Choice)
4.9/5 (35)
The sampling distribution of sample means taken from a process has less variability than the distribution of the process.
(True/False)
4.7/5 (45)
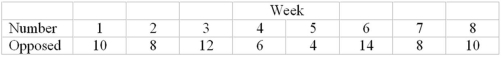
A town's department of public works is concerned about adverse public reaction to a sewer project that is currently in progress.Because of this,the Commissioner of Public Works has authorized a weekly survey to be conducted of town residents.Each week,a sample of 100 residents is questioned on their feelings towards the project.The results to date are shown below.Analyze this data using an appropriate control chart with a 5% risk of Type I error.Is the community sentiment stable?
(Essay)
4.8/5 (44)
The specifications for a product are 6 mm ±0.1 mm.The process is known to operate at a mean of 6.05 mm with a standard deviation of 0.01 mm.What is the Cpkfor this process?
(Multiple Choice)
4.9/5 (45)
Filters
- Essay(0)
- Multiple Choice(0)
- Short Answer(0)
- True False(0)
- Matching(0)