Exam 10: A: Statistical Quality Control
Exam 1: Introduction to Operations Management63 Questions
Exam 2: Competitiveness, Strategic Planning, and Productivity54 Questions
Exam 3: Demand Forecasting172 Questions
Exam 4: A: Product Design74 Questions
Exam 4: B: Product Design56 Questions
Exam 5: A: Strategic Capacity Planning74 Questions
Exam 5: B: Strategic Capacity Planning64 Questions
Exam 6: A: Process Design and Facility Layout157 Questions
Exam 6: B: Process Design and Facility Layout99 Questions
Exam 7: A: Design of Work Systems143 Questions
Exam 7: B: Design of Work Systems68 Questions
Exam 8: A: Location Planning and Analysis74 Questions
Exam 8: B: Location Planning and Analysis16 Questions
Exam 9: Management of Quality98 Questions
Exam 10: A: Statistical Quality Control121 Questions
Exam 10: B: Statistical Quality Control61 Questions
Exam 11: Supply Chain Management86 Questions
Exam 12: Inventory Management168 Questions
Exam 13: Aggregate Operations Planning71 Questions
Exam 14: Material Requirements Planning and Enterprise Resource Planning84 Questions
Exam 15: A: Just-In-Time and Lean Production82 Questions
Exam 15: B: Just-In-Time and Lean Production32 Questions
Exam 16: Job and Staff Scheduling112 Questions
Exam 17: Project Management127 Questions
Exam 18: A: Waiting-Line Analysis76 Questions
Exam 18: B: Waiting-Line Analysis41 Questions
Select questions type
If he uses upper and lower control limits of 23 and 17 ounces,on what day(s),if any,does this process appear to be out of control?
(Multiple Choice)
4.8/5  (33)
(33)
Control charts based on attribute data are for process characteristics that are counted rather than measured.
(True/False)
4.8/5 (31)
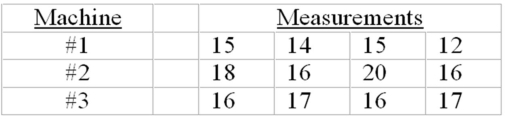
Given the following process control data for a normally distributed quality variable (three samples of size four each):
 -If the process is known to have a mean of 15 and a standard deviation of 3,what is the mean of the sampling distribution of sample means for whenever this process is under control?
The standard deviation?
-If the process is known to have a mean of 15 and a standard deviation of 3,what is the mean of the sampling distribution of sample means for whenever this process is under control?
The standard deviation?
(Short Answer)
4.9/5 (30)
The range chart (R-chart)is most likely to detect a change in:
(Multiple Choice)
4.9/5 (40)
Given the following process control data for a normally distributed quality variable (three samples of size four each):
-If the process is known to have a mean of 15 and a standard deviation of 3,what is the alpha risk (probability of Type I error)for upper and lower control limits of 16.5 and 13.5 respectively?
18 and 12?
19.5 and 10.5?
(Short Answer)
4.9/5 (30)
Approximately 99.7% of sample means will fall within ± two standard deviations of the process mean.
(True/False)
4.8/5 (30)
The probability of concluding that an assignable variation exists when only random variation is present is:
I.the probability of a Type I error.
II.known as the alpha risk.
III.highly unlikely.
IV.the sum of probabilities in the two tails of the distribution.
(Multiple Choice)
4.8/5 (31)
Control limits are determined based on design specification limits.
(True/False)
4.7/5 (44)
There is no direct link between design specifications and statistical process control limits.
(True/False)
4.9/5 (34)
Control limits are specifications established by engineering design or customer requirements.
(True/False)
4.9/5 (36)
A c-chart is used to monitor the number of defectives in the output of a process.
(True/False)
4.8/5 (36)
The specification limits for a product are 8 cm and 10 cm.A process that produces the product has a mean of 9.5 cm and a standard deviation of 0.2 cm.What is the process capability,Cpk?
(Multiple Choice)
4.7/5 (31)
The optimum level of inspection minimizes the sum of inspection costs and the cost of passing defectives.
(True/False)
4.8/5 (39)
Concluding that a process has not changed when it has is known as a Type I error.
(True/False)
4.8/5 (39)
A shift in the process mean for a measured quality characteristic would most likely be detected by a(n):
(Multiple Choice)
4.9/5 (33)
Which of the following quality control sample statistics measures a quality characteristic which is an attribute?
(Multiple Choice)
4.7/5 (43)
The probability of a Type I error is the probability of concluding that assignable variation is present even though only random variation exists.
(True/False)
4.7/5 (37)
Quality control efforts that occur during production are referred to as statistical process control.
(True/False)
4.8/5 (27)
Filters
- Essay(0)
- Multiple Choice(0)
- Short Answer(0)
- True False(0)
- Matching(0)