Exam 10: A: Statistical Quality Control
Exam 1: Introduction to Operations Management63 Questions
Exam 2: Competitiveness, Strategic Planning, and Productivity54 Questions
Exam 3: Demand Forecasting172 Questions
Exam 4: A: Product Design74 Questions
Exam 4: B: Product Design56 Questions
Exam 5: A: Strategic Capacity Planning74 Questions
Exam 5: B: Strategic Capacity Planning64 Questions
Exam 6: A: Process Design and Facility Layout157 Questions
Exam 6: B: Process Design and Facility Layout99 Questions
Exam 7: A: Design of Work Systems143 Questions
Exam 7: B: Design of Work Systems68 Questions
Exam 8: A: Location Planning and Analysis74 Questions
Exam 8: B: Location Planning and Analysis16 Questions
Exam 9: Management of Quality98 Questions
Exam 10: A: Statistical Quality Control121 Questions
Exam 10: B: Statistical Quality Control61 Questions
Exam 11: Supply Chain Management86 Questions
Exam 12: Inventory Management168 Questions
Exam 13: Aggregate Operations Planning71 Questions
Exam 14: Material Requirements Planning and Enterprise Resource Planning84 Questions
Exam 15: A: Just-In-Time and Lean Production82 Questions
Exam 15: B: Just-In-Time and Lean Production32 Questions
Exam 16: Job and Staff Scheduling112 Questions
Exam 17: Project Management127 Questions
Exam 18: A: Waiting-Line Analysis76 Questions
Exam 18: B: Waiting-Line Analysis41 Questions
Select questions type
Which of the following is not a step in the quality control planning process?
(Multiple Choice)
4.9/5  (45)
(45)
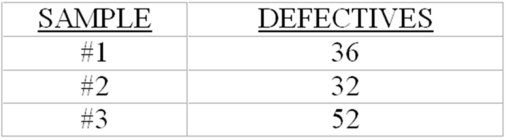
Given the following process control data for a quality attribute (three samples of size 400 each):
 -If the process proportion of defectives is unknown,what is the estimate of it?
(Short Answer)
4.7/5 (43)
Even when the sample size is fairly small,the sampling distribution can be assumed to be approximately normal even if the underlying process distribution is not normally distributed.
(True/False)
4.7/5 (35)
Given the following process control data for a normally distributed quality variable (three samples of size four each):
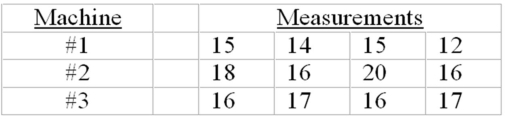 -If the process is known to have a mean of 15 and a standard deviation of 3,what are the three sigma upper and lower control limits for an x-bar chart?
(Essay)
4.8/5 (39)
Statistical process control is based on comparing periodic samples from a process to predetermined limits.
(True/False)
4.9/5 (27)
Low-cost,high-volume items typically require relatively low levels of inspection.
(True/False)
5.0/5 (29)
Six sigma quality refers to achieving process variation so small that the half-width of the design specification equals six times the standard deviation of the process.
(True/False)
4.8/5 (47)
Concluding that a process has changed when it has not is known as a Type II error.
(True/False)
4.9/5 (39)
Given the following process control data for a quality attribute (three samples of size 400 each):
-What is the sample proportion of defectives for sample #1?
#2?
#3?
(Short Answer)
4.7/5 (41)
Using the factors for three sigma control limits,what are the sample range (R)chart upper and lower control limits?
(Multiple Choice)
4.9/5 (38)
Attributes are process characteristics that must be measured rather than counted.
(True/False)
4.8/5 (39)
Given the following process control data for a quality attribute (three samples of size 400 each):
-If the process proportion of defectives is unknown,using .10 alpha risk control limits,do any of the sample proportions indicate an out-of-control process proportion of defectives?
(Short Answer)
4.8/5 (24)
The main task in process control is to distinguish assignable from random variation.
(True/False)
4.9/5 (44)
Given the following process control data for a quality attribute (three samples of size 400 each):
-If the process proportion of defectives is unknown,what is the alpha risk (probability of Type I error)for upper and lower control limits of .115 and .085 respectively?
.13 and .07?
.145 and .055?
(Short Answer)
4.8/5 (35)
What is the sample average range based upon this limited sample?
(Multiple Choice)
4.7/5 (43)
A process capability index (Cp)of 0.70 indicates that a process is capable of producing to design specifications.
(True/False)
4.8/5 (40)
A point which is outside of the lower control limit on an R-chart:
(Multiple Choice)
4.9/5 (32)
If upper and lower control limits were set as 0.028 and 0.010,which machine(s),if any,appear(s)to be out-of-control for process proportion of defectives?
(Multiple Choice)
4.8/5 (40)
Given the following process control data for a quality attribute (three samples of size 400 each):
-If the process proportion of defectives is unknown,what are the upper and lower control limits for an alpha risk of .10?
.05?
.01?
(Essay)
4.9/5 (41)
Filters
- Essay(0)
- Multiple Choice(0)
- Short Answer(0)
- True False(0)
- Matching(0)