Exam 18: Model Building
Exam 1: What Is Statistics46 Questions
Exam 2: Graphical Descriptive Techniques 194 Questions
Exam 3: Graphical Descriptive Techniques 2156 Questions
Exam 4: Numerical Descriptive Techniques275 Questions
Exam 5: Data Collection and Sampling84 Questions
Exam 6: Probability240 Questions
Exam 7: Random Variables and Discrete Probability Distributions283 Questions
Exam 8: Continuous Probability Distributions224 Questions
Exam 9: Sampling Distributions156 Questions
Exam 10: Introduction to Estimation154 Questions
Exam 11: Introduction to Hypothesis Testing189 Questions
Exam 12: Inference About a Population153 Questions
Exam 13: Inference About Comparing Two Populations170 Questions
Exam 14: Analysis of Variance157 Questions
Exam 15: Chi-Squared Tests179 Questions
Exam 16: Simple Linear Regression and Correlation304 Questions
Exam 17: Multiple Regression160 Questions
Exam 18: Model Building148 Questions
Exam 19: Nonparametric Statistics175 Questions
Exam 20: Time-Series Analytics and Forecasting225 Questions
Exam 21: Statistical Process Control140 Questions
Exam 22: Decision Analysis123 Questions
Exam 23: Conclusion47 Questions
Select questions type
For the following regression equation  ,a unit increase in x1,while holding x2 constant at a value of 2,decreases the value of y on average by:
(Multiple Choice)
4.8/5  (34)
(34)
Computer Training
Consider the following data for two variables,x and y.The independent variable x represents the amount of training time (in hours)for a salesperson starting in a new computer store to adjust fully,and the dependent variable y represents the weekly sales (in $1000s).  Use statistical software to answer the following question(s).
-{Computer Training Narrative} Determine if there is sufficient evidence at the 5% significance level to infer that the quadratic relationship between y,x,and x2 in the previous question is significant.
Use statistical software to answer the following question(s).
-{Computer Training Narrative} Determine if there is sufficient evidence at the 5% significance level to infer that the quadratic relationship between y,x,and x2 in the previous question is significant.
(Essay)
4.9/5 (41)
Suppose that the sample regression line of the first-order model is  .If we examine the relationship between y and x1 for three different values of x2,we observe that the effect of x1 on y remains the same no matter what the value of x2.
(True/False)
5.0/5 (32)
Incomes of Physicians
An economist is analyzing the incomes of physicians (general practitioners,surgeons,and psychiatrists).He realizes that an important factor is the number of years of experience.However,he wants to know if there are differences among the three professional groups.He takes a random sample of 125 physicians and estimates the multiple regression model y = β0 + β1x1 + β2x2 + β3x3 + ε,where y = annual income (in $1,000),x1 = years of experience,x2 = 1 if physician and 0 if not,and x3 = 1 if surgeons and 0 if not.The computer output is shown below. THE REGRESSION EQUATION IS y = 71.65 + 2.07x1 + 10.16x2− 7.44x3 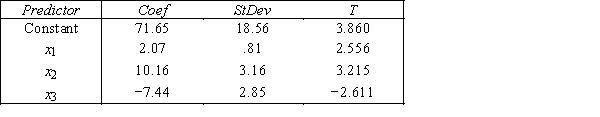 S = 42.6 R−Sq = 30.9% ANALYSIS OF VARIANCE
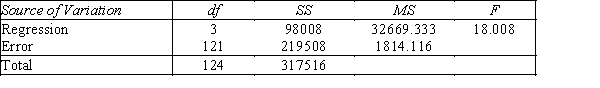
-{Incomes of Physicians Narrative} Do these results allow us to conclude at the 1% significance level that the model is useful in predicting the income of physicians?
-{Incomes of Physicians Narrative} Do these results allow us to conclude at the 1% significance level that the model is useful in predicting the income of physicians?
(Essay)
4.9/5 (49)
In a stepwise regression procedure,if two independent variables are highly correlated,then:
(Multiple Choice)
5.0/5 (37)
Suppose that the sample regression equation of a second-order model is given by 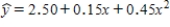 .Then,the value 4.60 is the:
(Multiple Choice)
4.9/5 (31)
In a first-order model with two predictors x1 and x2,an interaction term may be used when the relationship between the dependent variable y and the predictor variables is linear.
(True/False)
4.9/5 (45)
In general,to represent a nominal independent variable that has c possible categories,we would create (c− 1)dummy variables.
(True/False)
4.9/5 (45)
Hockey Teams
An avid hockey fan was in the process of examining the factors that determine the success or failure of hockey teams.He noticed that teams with many rookies and teams with many veterans seem to do quite poorly.To further analyze his beliefs he took a random sample of 20 teams and proposed a second-order model with one independent variable,average years of professional experience.The selected model is y = β0 + β1x + β2x2 + ε,where y = winning team's percentage,and x = average years of professional experience.The computer output is shown below. THE REGRESSION EQUATION IS y = 32.6 + 5.96x− .48x2 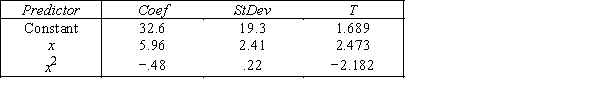 S = 16.1 R−Sq = 43.9% ANALYSIS OF VARIANCE
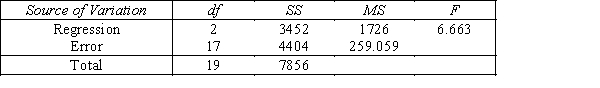
-{Hockey Teams Narrative} Test to determine at the 10% significance level if the x2 term should be retained.
-{Hockey Teams Narrative} Test to determine at the 10% significance level if the x2 term should be retained.
(Essay)
4.8/5 (40)
Motorcycle Fatalities
A traffic consultant has analyzed the factors that affect the number of motorcycle fatalities.She has come to the conclusion that two important variables are the number of motorcycle and the number of cars.She proposed the model  (the second-order model with interaction),where y = number of annual fatalities per county,x1 = number of motorcycles registered in the county (in 10,000),and x2 = number of cars registered in the county (in 1000).The computer output (based on a random sample of 35 counties)is shown below: THE REGRESSION EQUATION IS
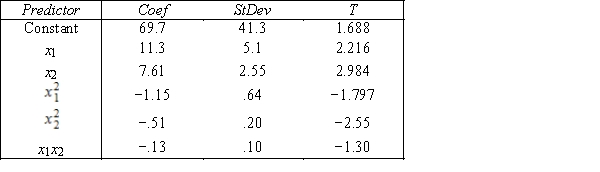 S = 15.2 R−Sq = 47.2% ANALYSIS OF VARIANCE
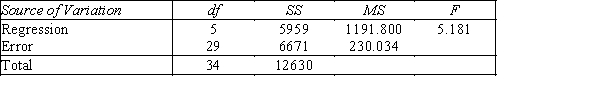
-{Motorcycle Fatalities Narrative} What is the multiple coefficient of determination? What does this statistic tell you about the model?
-{Motorcycle Fatalities Narrative} What is the multiple coefficient of determination? What does this statistic tell you about the model?
(Essay)
4.9/5 (38)
The stepwise regression procedure begins by computing the multiple regression model for all independent variables of interest.
(True/False)
5.0/5 (42)
If the odds ratio that an obese person who smokes 15 or more cigarettes per day suffers a heart attack is 9,then the probability that the person will suffer a heart attack is 0.81.
(True/False)
4.8/5 (38)
In explaining starting salaries for graduates of psychology programs,which of the following independent variables would not best be represented with dummy variables?
(Multiple Choice)
4.8/5 (33)
Computer Training
Consider the following data for two variables,x and y.The independent variable x represents the amount of training time (in hours)for a salesperson starting in a new computer store to adjust fully,and the dependent variable y represents the weekly sales (in $1000s). Use statistical software to answer the following question(s).
-{Computer Training Narrative} Determine the coefficient of determination quadratic model.What does this statistic tell you about this model?
(Essay)
4.9/5 (47)
If a quadratic relationship exists between y and each of x1 and x2,you use a(n)____________________-order polynomial model.
(Short Answer)
4.7/5 (39)
In general,to represent a nominal variable with m categories,we must create _______________ indicator variables.The last category represented by I1 = I2 = .....Im−1 = 0 is called the _______________ category.
(Short Answer)
4.8/5 (33)
In stepwise regression,if two independent variables are highly correlated,both variables must enter the model simultaneously.
(True/False)
4.8/5 (39)
The ____________________ variable of a regression model is the variable that you wish to analyze or predict.
(Short Answer)
4.9/5 (31)
In a multiple regression analysis,which procedure permits variables to enter and leave the model at different stages of its development?
(Multiple Choice)
4.8/5 (34)
Another name for an indicator variable is an interval variable.
(True/False)
4.9/5 (37)
Filters
- Essay(0)
- Multiple Choice(0)
- Short Answer(0)
- True False(0)
- Matching(0)