Exam 18: Model Building
Exam 1: What Is Statistics46 Questions
Exam 2: Graphical Descriptive Techniques 194 Questions
Exam 3: Graphical Descriptive Techniques 2156 Questions
Exam 4: Numerical Descriptive Techniques275 Questions
Exam 5: Data Collection and Sampling84 Questions
Exam 6: Probability240 Questions
Exam 7: Random Variables and Discrete Probability Distributions283 Questions
Exam 8: Continuous Probability Distributions224 Questions
Exam 9: Sampling Distributions156 Questions
Exam 10: Introduction to Estimation154 Questions
Exam 11: Introduction to Hypothesis Testing189 Questions
Exam 12: Inference About a Population153 Questions
Exam 13: Inference About Comparing Two Populations170 Questions
Exam 14: Analysis of Variance157 Questions
Exam 15: Chi-Squared Tests179 Questions
Exam 16: Simple Linear Regression and Correlation304 Questions
Exam 17: Multiple Regression160 Questions
Exam 18: Model Building148 Questions
Exam 19: Nonparametric Statistics175 Questions
Exam 20: Time-Series Analytics and Forecasting225 Questions
Exam 21: Statistical Process Control140 Questions
Exam 22: Decision Analysis123 Questions
Exam 23: Conclusion47 Questions
Select questions type
In order to represent a nominal variable with m categories,we must create m− 1 indicator variables.
(True/False)
4.8/5  (38)
(38)
In general,on what basis are independent variables selected for entry into the equation during stepwise regression?
(Essay)
4.8/5 (35)
An indicator variable (also called a dummy variable)is a variable that can assume either one of two values (usually 0 and 1),where one value represents the existence of a certain condition,and the other value indicates that the condition does not hold.
(True/False)
4.7/5 (33)
Computer Training
Consider the following data for two variables,x and y.The independent variable x represents the amount of training time (in hours)for a salesperson starting in a new computer store to adjust fully,and the dependent variable y represents the weekly sales (in $1000s).  Use statistical software to answer the following question(s).
-{Computer Training Narrative} Find the coefficient of determination of this simple linear model.What does this statistic tell you about the model?
Use statistical software to answer the following question(s).
-{Computer Training Narrative} Find the coefficient of determination of this simple linear model.What does this statistic tell you about the model?
(Essay)
4.8/5 (28)
The model y = β0 + β1x1 + β2x2 + β3x1x2 + ε is referred to as a:
(Multiple Choice)
4.9/5 (35)
Silver Prices
An economist is in the process of developing a model to predict the price of silver.She believes that the two most important variables are the price of a barrel of oil (x1)and the interest rate (x2).She proposes the first-order model with interaction: y = β0 + β1x1 + β2x2 + β3x1x3 + ε.A random sample of 20 daily observations was taken.The computer output is shown below. THE REGRESSION EQUATION IS y = 115.6 + 22.3x1 + 14.7x2− 1.36x1x2 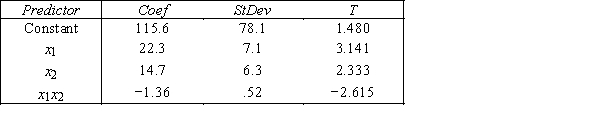 S = 20.9 R−Sq = 55.4% ANALYSIS OF VARIANCE
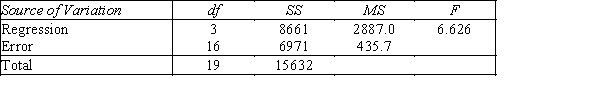
-{Silver Prices Narrative} Interpret the coefficient b2.
-{Silver Prices Narrative} Interpret the coefficient b2.
(Essay)
4.8/5 (40)
Computer Training
Consider the following data for two variables,x and y.The independent variable x represents the amount of training time (in hours)for a salesperson starting in a new computer store to adjust fully,and the dependent variable y represents the weekly sales (in $1000s). Use statistical software to answer the following question(s).
-{Computer Training Narrative} Determine if there is sufficient evidence at the 5% significance level to infer that the relationship between x and y is positive and significant.
(Essay)
4.9/5 (30)
Motorcycle Fatalities
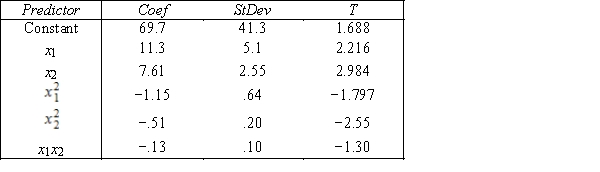
A traffic consultant has analyzed the factors that affect the number of motorcycle fatalities.She has come to the conclusion that two important variables are the number of motorcycle and the number of cars.She proposed the model  (the second-order model with interaction),where y = number of annual fatalities per county,x1 = number of motorcycles registered in the county (in 10,000),and x2 = number of cars registered in the county (in 1000).The computer output (based on a random sample of 35 counties)is shown below: THE REGRESSION EQUATION IS
 S = 15.2 R−Sq = 47.2% ANALYSIS OF VARIANCE
-{Motorcycle Fatalities Narrative} Test at the 1% significance level to determine if the interaction term should be retained in the model.
-{Motorcycle Fatalities Narrative} Test at the 1% significance level to determine if the interaction term should be retained in the model.
(Essay)
4.9/5 (36)
Senior Medical Students
A professor of Anatomy wanted to develop a multiple regression model to predict the students' grades in her fourth-year medical course.She decides that the two most important factors are the student's grade point average in the first three years and the student's major.She proposes the model y = β0 + β1x1 + β2x2 + β3x3 + ε,where y = Fourth-year medical course final score (out of 100),x1 = G.P.A.in first three years (range from 0 to 12),x2 = 1 if student's major is medicine and 0 if not,and x3 = 1 if student's major is biology and 0 if not.The computer output is shown below. THE REGRESSION EQUATION IS y = 9.14 + 6.73x1 + 10.42x2 + 5.16x3 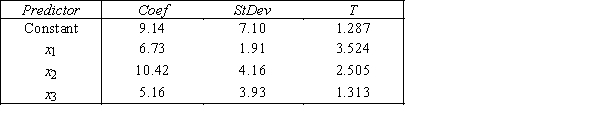 S = 15.0 R−Sq = 44.2% ANALYSIS OF VARIANCE
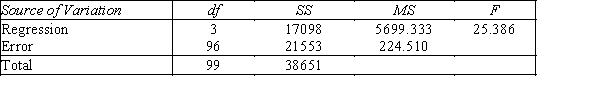
-{Senior Medical Students Narrative} Do these results allow us to conclude at the 1% significance level that grade point average in first three years is linearly related to the fourth-year medical final grade?
-{Senior Medical Students Narrative} Do these results allow us to conclude at the 1% significance level that grade point average in first three years is linearly related to the fourth-year medical final grade?
(Essay)
4.8/5 (38)
Incomes of Physicians
An economist is analyzing the incomes of physicians (general practitioners,surgeons,and psychiatrists).He realizes that an important factor is the number of years of experience.However,he wants to know if there are differences among the three professional groups.He takes a random sample of 125 physicians and estimates the multiple regression model y = β0 + β1x1 + β2x2 + β3x3 + ε,where y = annual income (in $1,000),x1 = years of experience,x2 = 1 if physician and 0 if not,and x3 = 1 if surgeons and 0 if not.The computer output is shown below. THE REGRESSION EQUATION IS y = 71.65 + 2.07x1 + 10.16x2− 7.44x3 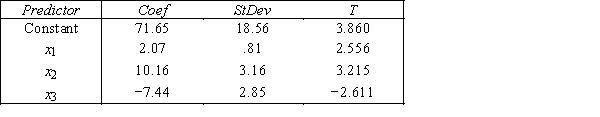 S = 42.6 R−Sq = 30.9% ANALYSIS OF VARIANCE
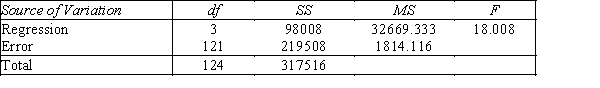
-{Incomes of Physicians Narrative} Is there enough evidence at the 1% significant level to conclude that general practitioners earn more on average than psychiatrists?
-{Incomes of Physicians Narrative} Is there enough evidence at the 1% significant level to conclude that general practitioners earn more on average than psychiatrists?
(Essay)
4.9/5 (41)
Computer Training
Consider the following data for two variables,x and y.The independent variable x represents the amount of training time (in hours)for a salesperson starting in a new computer store to adjust fully,and the dependent variable y represents the weekly sales (in $1000s). Use statistical software to answer the following question(s).
-{Computer Training Narrative} Use the quadratic model to predict the value of y when x = 45.
(Essay)
4.8/5 (37)
____________________ means that the effect of x1 on y is influenced by the value of x2,and vice versa.
(Short Answer)
4.8/5 (43)
When a dummy variable is included in a multiple regression model,the interpretation of the estimated slope coefficient does not make any sense anymore.
(True/False)
4.9/5 (34)
Suppose that the sample regression equation of a model is 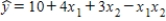 .The term
  is referred to as:
(Multiple Choice)
4.9/5 (42)
Silver Prices
An economist is in the process of developing a model to predict the price of silver.She believes that the two most important variables are the price of a barrel of oil (x1)and the interest rate (x2).She proposes the first-order model with interaction: y = β0 + β1x1 + β2x2 + β3x1x3 + ε.A random sample of 20 daily observations was taken.The computer output is shown below. THE REGRESSION EQUATION IS y = 115.6 + 22.3x1 + 14.7x2− 1.36x1x2 S = 20.9 R−Sq = 55.4% ANALYSIS OF VARIANCE
-{Silver Prices Narrative} Is there sufficient evidence at the 1% significance level to conclude that the interest rate and the price of silver are linearly related?
(Essay)
4.9/5 (43)
In building a regression model,it is best to use the ____________________ number of independent variables that produce a satisfactory model.
(Short Answer)
4.9/5 (32)
One of the requirements of regression analysis is that the dependent variable must be:
(Multiple Choice)
4.7/5 (42)
In the first-order model 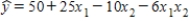 ,a unit increase in x2,while holding x1 constant at a value of 3,decreases the value of y on average by 3 units.
(True/False)
4.8/5 (39)
Hockey Teams
An avid hockey fan was in the process of examining the factors that determine the success or failure of hockey teams.He noticed that teams with many rookies and teams with many veterans seem to do quite poorly.To further analyze his beliefs he took a random sample of 20 teams and proposed a second-order model with one independent variable,average years of professional experience.The selected model is y = β0 + β1x + β2x2 + ε,where y = winning team's percentage,and x = average years of professional experience.The computer output is shown below. THE REGRESSION EQUATION IS y = 32.6 + 5.96x− .48x2 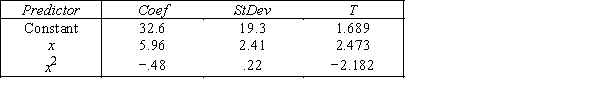 S = 16.1 R−Sq = 43.9% ANALYSIS OF VARIANCE
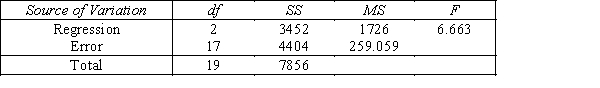
-{Hockey Teams Narrative} Predict the winning percentage for a hockey team with an average of 6 years of professional experience.
-{Hockey Teams Narrative} Predict the winning percentage for a hockey team with an average of 6 years of professional experience.
(Essay)
4.7/5 (29)
Filters
- Essay(0)
- Multiple Choice(0)
- Short Answer(0)
- True False(0)
- Matching(0)