Exam 18: Model Building
Exam 1: What Is Statistics46 Questions
Exam 2: Graphical Descriptive Techniques 194 Questions
Exam 3: Graphical Descriptive Techniques 2156 Questions
Exam 4: Numerical Descriptive Techniques275 Questions
Exam 5: Data Collection and Sampling84 Questions
Exam 6: Probability240 Questions
Exam 7: Random Variables and Discrete Probability Distributions283 Questions
Exam 8: Continuous Probability Distributions224 Questions
Exam 9: Sampling Distributions156 Questions
Exam 10: Introduction to Estimation154 Questions
Exam 11: Introduction to Hypothesis Testing189 Questions
Exam 12: Inference About a Population153 Questions
Exam 13: Inference About Comparing Two Populations170 Questions
Exam 14: Analysis of Variance157 Questions
Exam 15: Chi-Squared Tests179 Questions
Exam 16: Simple Linear Regression and Correlation304 Questions
Exam 17: Multiple Regression160 Questions
Exam 18: Model Building148 Questions
Exam 19: Nonparametric Statistics175 Questions
Exam 20: Time-Series Analytics and Forecasting225 Questions
Exam 21: Statistical Process Control140 Questions
Exam 22: Decision Analysis123 Questions
Exam 23: Conclusion47 Questions
Select questions type
In regression analysis,indicator variables allow us to incorporate:
(Multiple Choice)
4.8/5  (30)
(30)
A first-order model was used in regression analysis involving 25 observations to study the relationship between a dependent variable y and three independent variables x1,x2,and x3.The analysis showed that the mean squares for regression is 160 and the sum of squares for error is 1050.In addition,the following is a partial computer printout. 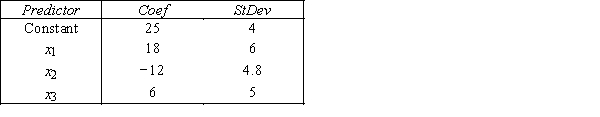 a.Develop the ANOVA table.
b.Is there enough evidence at the 5% significance level to conclude that the model is useful in predicting the value of y?
c.Test at the 5% significance level to determine whether x1 is linearly related to y.
d.Is there sufficient evidence at the 5% significance level to indicate that x2 is negatively linearly related to y?
e.Is there sufficient evidence at the 5% significance level to indicate that x3 is positively linearly related to y?
a.Develop the ANOVA table.
b.Is there enough evidence at the 5% significance level to conclude that the model is useful in predicting the value of y?
c.Test at the 5% significance level to determine whether x1 is linearly related to y.
d.Is there sufficient evidence at the 5% significance level to indicate that x2 is negatively linearly related to y?
e.Is there sufficient evidence at the 5% significance level to indicate that x3 is positively linearly related to y?
(Essay)
4.8/5 (41)
The model y = β0 + β1x1 + β2x2 + ε is referred to as a first-order model with two predictor variables with no interaction.
(True/False)
4.8/5 (41)
Motorcycle Fatalities
A traffic consultant has analyzed the factors that affect the number of motorcycle fatalities.She has come to the conclusion that two important variables are the number of motorcycle and the number of cars.She proposed the model  (the second-order model with interaction),where y = number of annual fatalities per county,x1 = number of motorcycles registered in the county (in 10,000),and x2 = number of cars registered in the county (in 1000).The computer output (based on a random sample of 35 counties)is shown below: THE REGRESSION EQUATION IS
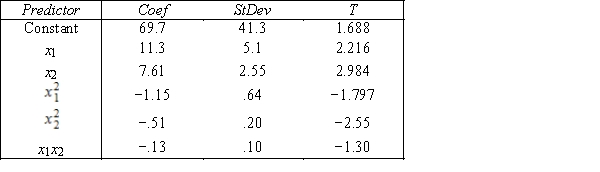 S = 15.2 R−Sq = 47.2% ANALYSIS OF VARIANCE
-{Motorcycle Fatalities Narrative} Test at the 1% significance level to determine if the
-{Motorcycle Fatalities Narrative} Test at the 1% significance level to determine if the  term should be retained in the model.
(Essay)
4.9/5 (42)
Senior Medical Students
A professor of Anatomy wanted to develop a multiple regression model to predict the students' grades in her fourth-year medical course.She decides that the two most important factors are the student's grade point average in the first three years and the student's major.She proposes the model y = β0 + β1x1 + β2x2 + β3x3 + ε,where y = Fourth-year medical course final score (out of 100),x1 = G.P.A.in first three years (range from 0 to 12),x2 = 1 if student's major is medicine and 0 if not,and x3 = 1 if student's major is biology and 0 if not.The computer output is shown below. THE REGRESSION EQUATION IS y = 9.14 + 6.73x1 + 10.42x2 + 5.16x3 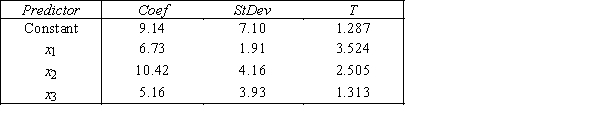 S = 15.0 R−Sq = 44.2% ANALYSIS OF VARIANCE
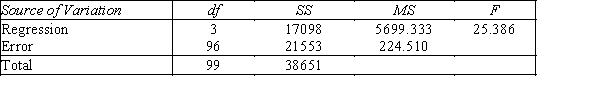
-{Senior Medical Students Narrative} Interpret the coefficient b3.
-{Senior Medical Students Narrative} Interpret the coefficient b3.
(Essay)
4.8/5 (38)
Senior Medical Students
A professor of Anatomy wanted to develop a multiple regression model to predict the students' grades in her fourth-year medical course.She decides that the two most important factors are the student's grade point average in the first three years and the student's major.She proposes the model y = β0 + β1x1 + β2x2 + β3x3 + ε,where y = Fourth-year medical course final score (out of 100),x1 = G.P.A.in first three years (range from 0 to 12),x2 = 1 if student's major is medicine and 0 if not,and x3 = 1 if student's major is biology and 0 if not.The computer output is shown below. THE REGRESSION EQUATION IS y = 9.14 + 6.73x1 + 10.42x2 + 5.16x3 S = 15.0 R−Sq = 44.2% ANALYSIS OF VARIANCE
-{Senior Medical Students Narrative} Predict the final grade (out of 100)in the fourth-year medical course for a medical student who has a 10.95 G.P.A.in their first three years (range from 0 to 12).
(Essay)
4.8/5 (33)
Silver Prices
An economist is in the process of developing a model to predict the price of silver.She believes that the two most important variables are the price of a barrel of oil (x1)and the interest rate (x2).She proposes the first-order model with interaction: y = β0 + β1x1 + β2x2 + β3x1x3 + ε.A random sample of 20 daily observations was taken.The computer output is shown below. THE REGRESSION EQUATION IS y = 115.6 + 22.3x1 + 14.7x2− 1.36x1x2 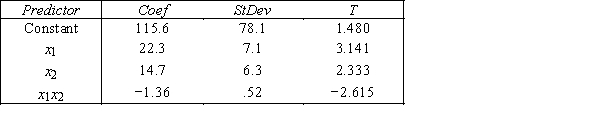 S = 20.9 R−Sq = 55.4% ANALYSIS OF VARIANCE
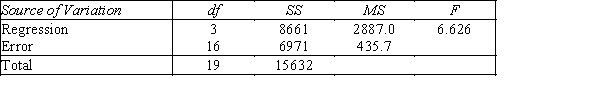
-{Silver Prices Narrative} Is there sufficient evidence at the 1% significance level to conclude that the price of a barrel of oil and the price of silver are linearly related?
-{Silver Prices Narrative} Is there sufficient evidence at the 1% significance level to conclude that the price of a barrel of oil and the price of silver are linearly related?
(Essay)
4.7/5 (39)
In stepwise regression the dependent variable must be ____________________.
(Short Answer)
4.9/5 (41)
The independent variable x in a polynomial model is called the ____________________ variable.
(Short Answer)
4.9/5 (48)
Senior Medical Students
A professor of Anatomy wanted to develop a multiple regression model to predict the students' grades in her fourth-year medical course.She decides that the two most important factors are the student's grade point average in the first three years and the student's major.She proposes the model y = β0 + β1x1 + β2x2 + β3x3 + ε,where y = Fourth-year medical course final score (out of 100),x1 = G.P.A.in first three years (range from 0 to 12),x2 = 1 if student's major is medicine and 0 if not,and x3 = 1 if student's major is biology and 0 if not.The computer output is shown below. THE REGRESSION EQUATION IS y = 9.14 + 6.73x1 + 10.42x2 + 5.16x3 S = 15.0 R−Sq = 44.2% ANALYSIS OF VARIANCE
-{Senior Medical Students Narrative} Do these results allow us to conclude at the 1% significance level that the model is useful in predicting the fourth-year medical course final grade?
(Essay)
4.8/5 (31)
Silver Prices
An economist is in the process of developing a model to predict the price of silver.She believes that the two most important variables are the price of a barrel of oil (x1)and the interest rate (x2).She proposes the first-order model with interaction: y = β0 + β1x1 + β2x2 + β3x1x3 + ε.A random sample of 20 daily observations was taken.The computer output is shown below. THE REGRESSION EQUATION IS y = 115.6 + 22.3x1 + 14.7x2− 1.36x1x2 S = 20.9 R−Sq = 55.4% ANALYSIS OF VARIANCE
-{Silver Prices Narrative} Is there sufficient evidence at the 1% significance level to conclude that the interaction term should be retained?
(Essay)
4.9/5 (27)
A logistic regression equation is  .
a.What is the estimated odds ratio for the event of interest occurring when x1 = 30,x2 = 60,x3 = 8,and x4 = 4?
b.What is the estimated probability of the event described in part a?
.
a.What is the estimated odds ratio for the event of interest occurring when x1 = 30,x2 = 60,x3 = 8,and x4 = 4?
b.What is the estimated probability of the event described in part a?
(Essay)
4.8/5 (39)
Suppose that the sample regression equation of a second-order model is given by 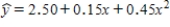 .Then,the value 2.50 is the:
(Multiple Choice)
4.9/5 (44)
What is stepwise regression,and when is it desirable to make use of this multiple regression technique?
(Essay)
4.8/5 (37)
The last category represented by I1 = I2 = .....Im−1 = 0 is called the omitted category.
(True/False)
4.9/5 (35)
It is possible to include ____________________ variables in a regression model.This is accomplished through the use of indicator (or dummy)variables.
(Short Answer)
4.7/5 (33)
Which of the following statements is false regarding the graph of the second-order polynomial model y = β0 + β1x + β2x2 + ε?
(Multiple Choice)
4.7/5 (36)
Computer Training
Consider the following data for two variables,x and y.The independent variable x represents the amount of training time (in hours)for a salesperson starting in a new computer store to adjust fully,and the dependent variable y represents the weekly sales (in $1000s).  Use statistical software to answer the following question(s).
-{Computer Training Narrative} Estimate the value of y when x = 45 using the estimated linear regression equation in the previous question.
Use statistical software to answer the following question(s).
-{Computer Training Narrative} Estimate the value of y when x = 45 using the estimated linear regression equation in the previous question.
(Essay)
4.8/5 (45)
Suppose that the sample regression equation of a model is 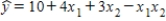 .If we examine the relationship between x1 and y for three different values of x2,we observe that the:
(Multiple Choice)
4.8/5 (42)
Filters
- Essay(0)
- Multiple Choice(0)
- Short Answer(0)
- True False(0)
- Matching(0)