Exam 13: Resource Management
Exam 1: Goods, Services, and Operations Management81 Questions
Exam 2: Value Chains87 Questions
Exam 3: Measuring Performance in Operations98 Questions
Exam 4: Operations Strategy82 Questions
Exam 5: Technology and Operations Management77 Questions
Exam 6: Goods and Service Design118 Questions
Exam 7: Process Selection, Design, and Analysis116 Questions
Exam 8: Facility and Work Designs92 Questions
Exam 9: Supply Chain Design87 Questions
Exam 10: Capacity Management89 Questions
Exam 11: Forecasting and Demand Planning95 Questions
Exam 12: Managing Inventories117 Questions
Exam 13: Resource Management106 Questions
Exam 14: Operations Scheduling and Sequencing79 Questions
Exam 15: Quality Management81 Questions
Exam 15: Appendix: Quality Management56 Questions
Exam 16: Quality Control and Spc110 Questions
Exam 16: Appendix: Queuing Analysis38 Questions
Exam 17: Appendix: Modeling Using Linear Programming41 Questions
Exam 17: Lean Operating Systems84 Questions
Exam 18: Appendix: Simulation40 Questions
Exam 18: Project Management108 Questions
Exam 19: Appendix: Decision Analysis44 Questions
Select questions type
The words "product family," "budget allocation," and "long-term" fit best with which level of the generic framework for resource planning?
Free
(Multiple Choice)
4.9/5  (36)
(36)
Correct Answer: Verified
A
A company makes traffic signals for downtown streets. They are interested in developing a product structure tree for one of their traffic signal models. Each traffic signal is composed of a housing and bracket assembly. Each housing assembly is composed of optical and casing subassemblies. Each bracket assembly is composed of a hanger part and a wire outlet part. The optical subassembly is composed of 4 wire lead subassemblies, 3 lens parts, 3 bulbs, and 3 socket parts. Each casing subassembly is composed of 3 plastic molds and 3 hardware subassemblies. Each wire lead subassembly is made up of 1 conductor part, 1 insulation part, and 4 spade connector parts. Each hardware subassembly is made up of 4 nuts, 4 bolts, and 8 washers.
a.How many spade connectors are needed to make one traffic signal?
b.How many bolts are needed to make one traffic signal?
Free
(Essay)
4.8/5 (42)
Correct Answer:Verified
a. 16 spade connectors; b. 12 bolts
a.4 connectors are in 1 wire lead and 4 wire leads are in 1 optical subassembly which are in 1
housing assembly which is in 1 traffic signal, for a total of 16 spade connectors.b.4 bolts are in 1 hardware subassembly, and 3 hardware subassemblies are in 1 casing subassembly which is in 1 housing assembly which is in 1 traffic signal, for a total of 12 bolts.
End items in a master production schedule (MPS) or final assembly schedule must be forecast.
Free
(True/False)
4.8/5 (35)
Correct Answer:Verified
True
A paint company has the following aggregate demand requirements and cost data for the upcoming year by quarter.
Table 2
QUARTER FORECAST DEMAND (UNITS) 1 1,200 2 1,500 3 1,900 4 1,000 TOTAL: 5,600 Previous quarter's production: 900 units Beginning inventory: 0 Backorder costs: \ 60/ unit Inventory-holding cost (on ending inventory): \ 12/ unit/quarter Hiring employees: \ 30/ unit increase Firing employees: \ 70/ unit decrease Unit cost: \ 45/ unit Overtime cost: \ 67.50/ unit ____________________________________________________________________
-Using the information in Table 2, determine the change in workforce costs (hiring and firing employees) if the paint company decides to use a chase strategy.
(Multiple Choice)
4.9/5 (29)
When demand is seasonal, inventory cannot be used to stabilize production and employment rates.
(True/False)
4.7/5 (30)
Which aggregate planning strategy generally would result in the least amount of inventory?
(Multiple Choice)
4.9/5 (31)
Determine the net requirement for E if the gross requirement for A is still 200 and current on-hand inventory balance for A is 60, D is 200, E is 100, and F is 600.
(Multiple Choice)
4.9/5 (32)
Which lot sizing rule is best when inventory carrying costs are high and setup/order costs are low?
(Multiple Choice)
4.8/5 (38)
Resources include materials, equipment, facilities, information, technical knowledge and skills, and people.
(True/False)
4.9/5 (38)
A company currently has no items in inventory. The demand for the next four months is 200, 400, 250, and 350 units. Assuming a level production rate of 250 units per month, determine the months in which backorders or stockouts will materialize.
(Multiple Choice)
4.8/5 (26)
Capacity requirements are computed by multiplying the number of units scheduled for production at a work center by:
(Multiple Choice)
4.9/5 (33)
The bill of material (BOM) for Products A and B are shown below followed by a table of inventory data (called Exhibit 1). The master production scheduling (MPS) for A calls for 150 units of A to be completed in Week 4 and another 225 units to be completed in Week 5. End item A has a two-week lead time. The MPS calls for 400 units of B to be completed in Week 6. End item B has a one-week lead time. 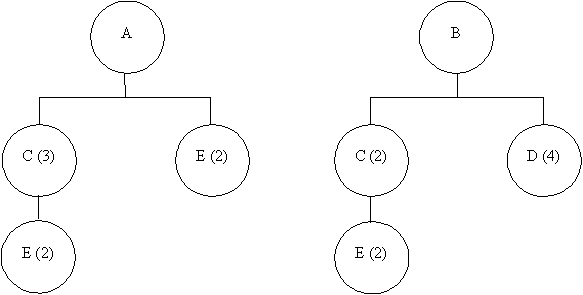 Exhibit 1
DATA CATEGORY C D E Lot Sizing Rule FOQ =800 LFL POQ =4 Lead Time 1 week 2 weeks 1 week Scheduled Receipt 400 (Week 1) 80 (Week 1) None Beginning Inventory 80 60 100 ____________________________________________________________________
-Using the data given in Exhibit 1, determine the gross requirements for Item E in Week 2.
Exhibit 1
DATA CATEGORY C D E Lot Sizing Rule FOQ =800 LFL POQ =4 Lead Time 1 week 2 weeks 1 week Scheduled Receipt 400 (Week 1) 80 (Week 1) None Beginning Inventory 80 60 100 ____________________________________________________________________
-Using the data given in Exhibit 1, determine the gross requirements for Item E in Week 2.
(Multiple Choice)
4.9/5 (30)
If A has a gross requirement to build 200 units and an on-hand inventory for A of 60, determine the net requirement for D if its current on-hand inventory balance for D is 200 (all other components have no (zero) current inventory).
(Multiple Choice)
4.7/5 (35)
Level 3 planning, i.e. detailed planning and execution, represents aggregate planning at higher management levels of an organization.
(True/False)
4.9/5 (27)
Which is the most comprehensive solution for a firm if a load report shows not enough capacity is available?
(Multiple Choice)
4.8/5 (39)
Define a master production schedule (MPS) and explain how it differs from a final assembly schedule.
(Essay)
4.9/5 (35)
An example of aggregation would be an ice cream manufacturer developing targets to produce a number of gallons of each flavor along with the purchasing requirements for specific ingredients for a one-week period.
(True/False)
4.8/5 (42)
The bill of material (BOM) for Products A and B are shown below followed by a table of inventory data (called Exhibit 1). The master production scheduling (MPS) for A calls for 150 units of A to be completed in Week 4 and another 225 units to be completed in Week 5. End item A has a two-week lead time. The MPS calls for 400 units of B to be completed in Week 6. End item B has a one-week lead time. Exhibit 1
DATA CATEGORY C D E Lot Sizing Rule FOQ =800 LFL POQ =4 Lead Time 1 week 2 weeks 1 week Scheduled Receipt 400 (Week 1) 80 (Week 1) None Beginning Inventory 80 60 100 ____________________________________________________________________
-Using the data given in Exhibit 1, determine the projected on-hand inventory for Item C, beginning in Week 8.
(Multiple Choice)
4.8/5 (24)
Filters
- Essay(0)
- Multiple Choice(0)
- Short Answer(0)
- True False(0)
- Matching(0)