Exam 16: Quality Control and Spc
Exam 1: Goods, Services, and Operations Management65 Questions
Exam 2: Value Chains68 Questions
Exam 3: Measuring Performance in Operations80 Questions
Exam 4: Operations Strategy65 Questions
Exam 5: Technology and Operations Management72 Questions
Exam 6: Goods and Service Design91 Questions
Exam 7: Process Selection, Design, and Analysis88 Questions
Exam 8: Facility and Work Design78 Questions
Exam 9: Supply Chain Design71 Questions
Exam 10: Capacity Management70 Questions
Exam 11: Forecasting and Demand Planning77 Questions
Exam 12: Managing Inventories89 Questions
Exam 13: Resource Management88 Questions
Exam 14: Operations Scheduling and Sequencing66 Questions
Exam 15: Quality Management72 Questions
Exam 16: Quality Control and Spc85 Questions
Exam 17: Lean Operating Systems63 Questions
Exam 18: Project Management63 Questions
Exam 19: Work Measurement, Learning Curves, and Standards57 Questions
Exam 20: Queuing Analysis38 Questions
Exam 21: Modeling Using Linear Programming44 Questions
Exam 22: Simulation38 Questions
Exam 23: Decision Analysis44 Questions
Select questions type
The center line (p-bar) for a p-chart is 0.50 with an UCL = 0.70 and a LCL = 0.35.The results of the next eight sample means are 0.45, 0.60, 0.39, 0.44, 0.48, 0.53, 0.54, and 0.61.What would you do?
Free
(Multiple Choice)
4.8/5  (31)
(31)
Correct Answer: Verified
D
A Procter and Gamble factory process fills boxes with detergent.Construct an appropriate set of control charts to monitor the process.Historical data for fill weight (in ounces) of eight samples is presented below.A sample size of six was used.  a.Compute the limits for both an R chart and x-bar chart.Compare the sample results to the limits of the charts.
b.Briefly explain what the quality control charts tell you.What actions, if any, would you take?
a.Compute the limits for both an R chart and x-bar chart.Compare the sample results to the limits of the charts.
b.Briefly explain what the quality control charts tell you.What actions, if any, would you take?
Free
(Essay)
4.8/5 (41)
Correct Answer:Verified
a.UCLR = (2.004)(.305) = 0.611
LCLR = (0)(.305) = 0
n = 6 ; R-bar = 2.44/8 = 0.305
x-bar = 128.24/8 = 16.03
R chart is in control
UCLX = 16.03 + (0.483)(.305) = 16.18
LCLX = 15.88
b.R-bar chart is stable and in control but x-bar chart is not in SPC.Stop the process and investigate sources (root causes) of error.
Define and give an example of the three components of any control system.
Free
(Essay)
4.8/5 (35)
Correct Answer:Verified
The three components of any control system are:
1. A performance standard or goal
2. A means of measuring actual performance
3. Comparison of actual performance with the standard to form the basis for corrective action
Many examples can be provided, such as driving, taking an exam, keeping an inventory of milk in your refrigerator, and so on.
If the mean in the range chart shifts down significantly, it indicates that the variation in the process has decreased.
(True/False)
4.8/5 (35)
As long as no points are outside of the control limits in a control chart, the process would be considered to be in control
(True/False)
4.8/5 (29)
Special cause variation tends to be easily detectable using statistical methods.
(True/False)
4.8/5 (34)
In manufacturing, quality control is generally applied at the receiving stage from suppliers, during various production processes, and at the finished goods stage.
(True/False)
4.9/5 (34)
Which of the following is not related to a continuous metric?
(Multiple Choice)
4.7/5 (46)
If process quality approaches six sigma levels, then standard types of control charts are not useful.
(True/False)
4.8/5 (30)
A system governed only by common causes is called a stable system.
(True/False)
4.7/5 (32)
An operator has determined what her percent defectives is for the machine which she operates.Based on several samples of 75 observations, she found p-bar to be 10%.She wants to set up a control chart using 3 standard deviation control limits.
a.What is the upper control limit for a p chart?
b.What is the lower control limit for a p chart?
(Essay)
4.8/5 (40)
Over-adjusting a process that is in control will usually increase the variation in the output.
(True/False)
4.9/5 (42)
A process is considered to be in control when all common and special causes have been eliminated.
(True/False)
5.0/5 (35)
A bottling process sometimes results in overfills or underfills.Overfills are especially damaging to the equipment.Which process capability index would this company most want to monitor?
(Multiple Choice)
4.9/5 (36)
Flaws are counted on a standard steel plate (sheet).Each sheet has the exact same dimensions.Ten sheets are selected at random and the number of flaws per sheet is as follows.
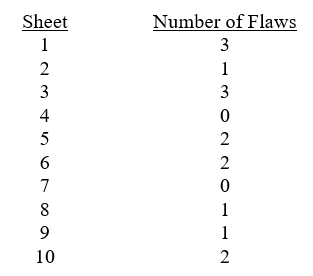 Determine the lower and upper control limits for a c chart..
(Essay)
4.9/5 (49)
A key element of a control system is the ability to measure performance and compare it to a performance standard.
(True/False)
4.9/5 (33)
Filters
- Essay(0)
- Multiple Choice(0)
- Short Answer(0)
- True False(0)
- Matching(0)