Exam 16: Quality Control and Spc
Exam 1: Goods, Services, and Operations Management65 Questions
Exam 2: Value Chains68 Questions
Exam 3: Measuring Performance in Operations80 Questions
Exam 4: Operations Strategy65 Questions
Exam 5: Technology and Operations Management72 Questions
Exam 6: Goods and Service Design91 Questions
Exam 7: Process Selection, Design, and Analysis88 Questions
Exam 8: Facility and Work Design78 Questions
Exam 9: Supply Chain Design71 Questions
Exam 10: Capacity Management70 Questions
Exam 11: Forecasting and Demand Planning77 Questions
Exam 12: Managing Inventories89 Questions
Exam 13: Resource Management88 Questions
Exam 14: Operations Scheduling and Sequencing66 Questions
Exam 15: Quality Management72 Questions
Exam 16: Quality Control and Spc85 Questions
Exam 17: Lean Operating Systems63 Questions
Exam 18: Project Management63 Questions
Exam 19: Work Measurement, Learning Curves, and Standards57 Questions
Exam 20: Queuing Analysis38 Questions
Exam 21: Modeling Using Linear Programming44 Questions
Exam 22: Simulation38 Questions
Exam 23: Decision Analysis44 Questions
Select questions type
A company that manufactures arrows for sale in archery stores is developing a new arrow with enhanced flight characteristics.From customer surveys the company has determined that the diameter of the arrow should be between 10.0 and 10.6 mm.They want to ensure the process they develop to produce the arrows will meet customer expectations; that is, the process capability index (Cp) will be greater than or equal to 1.00.
a.What value of the standard deviation of the process will yield a Cp equal to 1.00?
b.If the standard deviation of the process is actually .05, what would the diameter variation (UTL - LTL) of the arrow have to be to get a Cp of 1.00?
(Essay)
4.7/5  (37)
(37)
Process capability quantifies the variation that results from common causes.
(True/False)
5.0/5 (41)
Poor quality that might result from a broken tool or an employee who is ill would be an example of special cause variation.
(True/False)
4.7/5 (34)
Honda wants to monitor the number of blemishes (scratches, blisters, etc.) on the fenders of its cars using a statistical process control chart.The most appropriate type of SPC chart is
(Multiple Choice)
4.7/5 (39)
To account for the process centering, a two-sided capability index is often used.
(True/False)
4.8/5 (38)
The goal of statistical process control (SPC) is to help identify and eliminate unwanted causes of variation.
(True/False)
4.8/5 (44)
If one was monitoring the average time to load a web page, the chart to use would be the
(Multiple Choice)
4.8/5 (45)
The lower the rate of defects, the higher the sample size should be in p-charts.
(True/False)
4.8/5 (36)
With good management, all variability of output from any goods- or service-producing process can be eliminated.
(True/False)
4.8/5 (29)
If no special causes affect the output of a process, we say that the process is ____; when special causes are present, the process is said to be ____.
(Multiple Choice)
4.7/5 (41)
A company is measuring the time it takes to complete an order.Twenty five samples of size 6 resulted in an average time of 80 minutes with an average range of 20 minutes.Find control limits for the appropriate control chart(s) that would be used to monitor this process.
(Essay)
5.0/5 (27)
Discuss the difference between a continuous metric and a discrete metric, give examples of each, and list the common control charts associated with each.
(Essay)
4.9/5 (38)
Common cause variation generally accounts for about 10 to 15% of all variation within a process.
(True/False)
4.8/5 (40)
It is not necessary to have a process in control when establishing control limits.
(True/False)
5.0/5 (36)
A c-chart is used to monitor the fraction nonconforming, whereas a p-chart monitors the number of nonconformances per unit.
(True/False)
4.7/5 (36)
Testing whether a computer boots up the first time is an example of
(Multiple Choice)
4.7/5 (41)
A production process is sampled 24 times with a sample size of 6 yields an overall mean of 25.2 and an average range of 0.8.Determine the control limits for the x-bar and R charts.
(Essay)
4.7/5 (45)
Five samples were taken, with five observations each.The sample findings are listed below.The sample values represent service times in minutes.
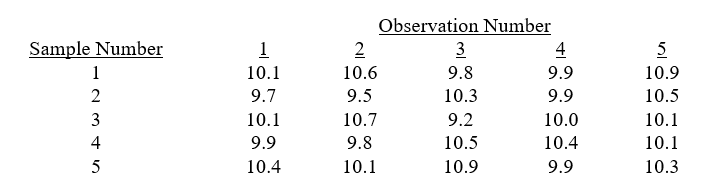 a.Determine the control limits for the R-chart.
b.Would you conclude the R-chart is in statistical control and proceed to develop the x-bar chart?
a.Determine the control limits for the R-chart.
b.Would you conclude the R-chart is in statistical control and proceed to develop the x-bar chart?
(Essay)
4.8/5 (37)
Fifteen samples of size 5 have been taken from a production process.The sum of the sample averages was found to be 92.54 cm while the sum of the ranges was 115.36.Find the values of the center lines for the x-bar and R charts.
(Essay)
5.0/5 (38)
Filters
- Essay(0)
- Multiple Choice(0)
- Short Answer(0)
- True False(0)
- Matching(0)