Exam 11: Forecasting and Demand Planning
Exam 1: Goods, Services, and Operations Management65 Questions
Exam 2: Value Chains68 Questions
Exam 3: Measuring Performance in Operations80 Questions
Exam 4: Operations Strategy65 Questions
Exam 5: Technology and Operations Management72 Questions
Exam 6: Goods and Service Design91 Questions
Exam 7: Process Selection, Design, and Analysis88 Questions
Exam 8: Facility and Work Design78 Questions
Exam 9: Supply Chain Design71 Questions
Exam 10: Capacity Management70 Questions
Exam 11: Forecasting and Demand Planning77 Questions
Exam 12: Managing Inventories89 Questions
Exam 13: Resource Management88 Questions
Exam 14: Operations Scheduling and Sequencing66 Questions
Exam 15: Quality Management72 Questions
Exam 16: Quality Control and Spc85 Questions
Exam 17: Lean Operating Systems63 Questions
Exam 18: Project Management63 Questions
Exam 19: Work Measurement, Learning Curves, and Standards57 Questions
Exam 20: Queuing Analysis38 Questions
Exam 21: Modeling Using Linear Programming44 Questions
Exam 22: Simulation38 Questions
Exam 23: Decision Analysis44 Questions
Select questions type
Sales of a new CD at a store for the last 4 weeks are shown below.
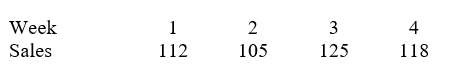 a.Find a 3 period moving average forecast for the next week.
b.Find a 4 period moving average forecast for the next week.
c.Actual sales for week 5 were 105 units.What would be the 3- and 4-period moving average forecasts for week 6?
a.Find a 3 period moving average forecast for the next week.
b.Find a 4 period moving average forecast for the next week.
c.Actual sales for week 5 were 105 units.What would be the 3- and 4-period moving average forecasts for week 6?
Free
(Essay)
4.9/5  (33)
(33)
Correct Answer: Verified
a.(105 + 125 + 118)/3 = 116
b.(112 + 105 + 125 + 118)/4 = 115
c.3-period: (125 + 1118 + 105)/3 = 116
4-period: (105 + 125 + 118 + 105)/4 = 113.25
Repeatable periods of ups and downs over short periods of time are called ____.
Free
(Multiple Choice)
4.7/5 (30)
Correct Answer:Verified
B
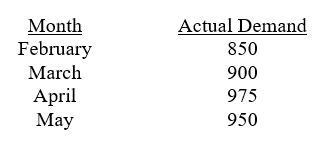
Based on the information shown below, develop forecasts for June using both a 2-period moving average model and an exponential smoothing model with = 0.10. For the exponential smoothing model, assume the forecast for February was 800.
Free
(Essay)
4.8/5 (47)
Correct Answer:Verified
Moving average model: FJUNE = (975 + 950)/2 = 962.5
Exponential smoothing model:
FFEB = 800
FMAR = 800 + .1(850 - 800) = 805
FAPR = 805 + .1(900 - 805) = 814.5
FMAY = 814.5 + .1(975 - 800) = 830.55
FJUN = 830.55 + .1(950 - 800) = 842.495
If single exponential smoothing is used and the time series has a negative trend, the forecast will
(Multiple Choice)
4.9/5 (38)
Describe some of the issues that managers must consider in applying forecasting methods in practice.
(Essay)
5.0/5 (38)
A major difference between MSE and MAD is that MAD is influenced much more by large forecast errors than by small errors.
(True/False)
4.8/5 (29)
The following data represents the home mortgage loan interest rates at a local bank over an eight-month period:
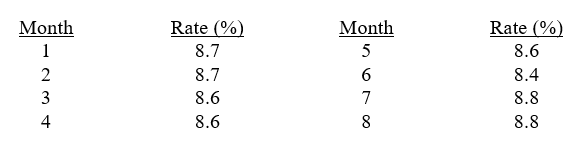 a.What is the forecast for month 8 using a moving average model with an AP = 4?
b.What is the forecast for month 9 using a moving average model with an AP = 6?
a.What is the forecast for month 8 using a moving average model with an AP = 4?
b.What is the forecast for month 9 using a moving average model with an AP = 6?
(Essay)
4.9/5 (40)
As the value of k is increased in a moving average forecasting model, the forecast reacts more slowly to recent changes in the time series.
(True/False)
4.7/5 (38)
Long range forecasts expressed in sales dollars are more meaningful to top managers than to managers at the operations level.
(True/False)
4.7/5 (29)
Better operational decisions can be made by integrating forecasting with value chain and capacity management systems.
(True/False)
4.7/5 (34)
Define regression analysis and explain how it is an approach to forecasting.
(Essay)
4.8/5 (35)
A single moving average is most appropriate for data with identifiable trends.
(True/False)
5.0/5 (40)
Discuss the three planning horizons used in forecasting and the types of decisions made in each.
(Essay)
4.8/5 (42)
In forecasting, irregular variation that is explainable can normally be discarded.
(True/False)
4.9/5 (34)
Valentine's Day is the best day of the year for selling roses at River Road Florist.Dozens of roses sold on Valentine's Day over six years are as follows:
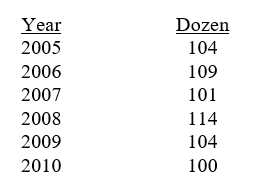 a.What is the forecast for Valentine's Day in 2011 using a 3-period moving average?
b.What is the forecast for Valentine's Day in 2011 using a 5-period moving average?
d.What is the MAD for years 2008 - 2010 using a 3-period moving average?
e.What is the tracking signal for years 2008 - 2010 using a 3-period moving average?
a.What is the forecast for Valentine's Day in 2011 using a 3-period moving average?
b.What is the forecast for Valentine's Day in 2011 using a 5-period moving average?
d.What is the MAD for years 2008 - 2010 using a 3-period moving average?
e.What is the tracking signal for years 2008 - 2010 using a 3-period moving average?
(Essay)
4.8/5 (32)
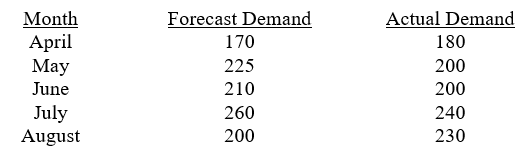
Using the data shown below, compute the mean square error, mean absolute deviation, and mean absolute percentage error for the forecasts shown.
(Essay)
4.8/5 (36)
Seasonal patterns can occur over the weeks during a month, over days during a week, or hours during a day.
(True/False)
5.0/5 (40)
____ forecasts are needed to plan work-force levels, allocate budgets among divisions and schedule jobs and resources.
(Multiple Choice)
4.8/5 (38)
Filters
- Essay(0)
- Multiple Choice(0)
- Short Answer(0)
- True False(0)
- Matching(0)