Exam 17: Multiple Regression
Exam 1: What Is Statistics39 Questions
Exam 2: Graphical and Tabular Descriptive Techniques192 Questions
Exam 3: Numerical Descriptive Techniques215 Questions
Exam 4: Data Collection and Sampling82 Questions
Exam 5: Probability200 Questions
Exam 6: Random Variables and Discrete Probability Distributions158 Questions
Exam 7: Continuous Probability Distributions149 Questions
Exam 8: Sampling Distributions127 Questions
Exam 9: Introduction to Estimation85 Questions
Exam 10: Introduction to Hypothesis Testing178 Questions
Exam 11: Inference About a Population75 Questions
Exam 12: Inference About Comparing Two Populations, Part 183 Questions
Exam 13: Inference About Comparing Two Populations, Part 284 Questions
Exam 14: Analysis of Variance125 Questions
Exam 15: Chi-Squared Tests118 Questions
Exam 16: Simple Linear Regression and Correlation231 Questions
Exam 17: Multiple Regression143 Questions
Exam 18: Review of Statistical Inference182 Questions
Select questions type
Because of multicollinearity, the t-tests of the individual coefficients may indicate that some independent variables are not linearly related to the dependent variable, when in fact they are.
(True/False)
5.0/5  (32)
(32)
Real Estate Builder: A real estate builder wishes to determine how house size is influenced by family income, family size, and education of the head of household. House size is measured in hundreds of square feet, income is measured in thousands of dollars, and education is measured in years. A partial computer output is shown below.
SUMMARY OUTPUT
 ANOVA
ANOVA

 -What minimum annual income would an individual with a family size of 4 and 16 years of education need to attain a predicted 10,000 square foot home?
(Essay)
4.8/5 (37)
An adverse effect of multicollinearity is that the estimated regression coefficients of the independent variables that are correlated tend to have large sampling ____________________.
(Short Answer)
4.8/5 (20)
A multiple regression equation includes 5 independent variables, and the coefficient of determination is 0.81. The percentage of the variation in y that is explained by the regression equation is:
(Multiple Choice)
4.8/5 (34)
Most statistical software print a second R2 statistic, called the coefficient of determination adjusted for degrees of freedom, which has been adjusted to take into account the sample size and the number of independent variables.
(True/False)
5.0/5 (32)
One clue to the presence of multicollinearity is an independent variable known to be an important predictor that ends up having a regression coefficient that is not ____________________.
(Short Answer)
4.8/5 (39)
In a multiple regression analysis involving 50 observations and 5 independent variables, the total variation in y is 475 and SSE = 71.25. Then, the coefficient of determination is 0.85.
(True/False)
4.8/5 (33)
When there is more than one independent variable in a regression model, we refer to the graphical depiction of the equation as a(n) ____________________ rather than as a straight line.
(Short Answer)
4.9/5 (36)
Real Estate Builder: A real estate builder wishes to determine how house size is influenced by family income, family size, and education of the head of household. House size is measured in hundreds of square feet, income is measured in thousands of dollars, and education is measured in years. A partial computer output is shown below.
SUMMARY OUTPUT
ANOVA
-What are the residual degrees of freedom that are missing from the output?
(Essay)
4.8/5 (29)
In a multiple regression analysis involving 6 independent variables, the total variation in y is 900 and SSR = 600. What is the value of SSE?
(Multiple Choice)
4.9/5 (40)
Real Estate Builder: A real estate builder wishes to determine how house size is influenced by family income, family size, and education of the head of household. House size is measured in hundreds of square feet, income is measured in thousands of dollars, and education is measured in years. A partial computer output is shown below.
SUMMARY OUTPUT
ANOVA
-One individual in the sample had an annual income of $100,000, a family size of 10, and an education of 16 years. This individual owned a home with an area of 7,000 square feet. What is the residual (in hundreds of square feet) for this data point?
(Essay)
4.8/5 (34)
Multicollinearity is present when there is a high degree of correlation between the independent variables included in the regression model.
(True/False)
4.8/5 (30)
Life Expectancy
An actuary wanted to develop a model to predict how long individuals will live. After consulting a number of physicians, she collected the age at death (y), the average number of hours of exercise per week (x1), the cholesterol level (x2), and the number of points that the individual's blood pressure exceeded the recommended value (x3). A random sample of 40 individuals was selected. The computer output of the multiple regression model is shown below.
THE REGRESSION EQUATION IS
y = 55.8 + 1.79x1 -0.021x2 - 0.061x3

 ANALYSIS OF VARIANCE
 -{Life Expectancy Narrative} What is the coefficient of determination? What does this statistic tell you?
(Essay)
4.9/5 (40)
A small value of F indicates that most of the variation in y is explained by the regression equation and that the model is useful.
(True/False)
4.9/5 (38)
A multiple regression model involves 5 independent variables and a sample of 10 data points. If we want to test the validity of the model at the 5% significance level, the critical value is:
(Multiple Choice)
4.8/5 (31)
Student's Final Grade: A statistics professor investigated some of the factors that affect an individual student's final grade in her course. She proposed the multiple regression model 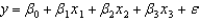 , where y is the final grade (out of 100 points), x1 is the number of lectures skipped, x2 is the number of late assignments, and x3 is the midterm exam score (out of 100). The professor recorded the data for 50 randomly selected students. The computer output is shown below.
THE REGRESSION EQUATION IS
, where y is the final grade (out of 100 points), x1 is the number of lectures skipped, x2 is the number of late assignments, and x3 is the midterm exam score (out of 100). The professor recorded the data for 50 randomly selected students. The computer output is shown below.
THE REGRESSION EQUATION IS 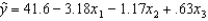

 ANALYSIS OF VARIANCE
 -Interpret the coefficient b3.
(Essay)
4.9/5 (34)
In a multiple regression analysis involving k independent variables and n data points, the number of degrees of freedom associated with the sum of squares for error is:
(Multiple Choice)
4.8/5 (34)
Filters
- Essay(0)
- Multiple Choice(0)
- Short Answer(0)
- True False(0)
- Matching(0)