Exam 17: Multiple Regression
Exam 1: What Is Statistics39 Questions
Exam 2: Graphical and Tabular Descriptive Techniques192 Questions
Exam 3: Numerical Descriptive Techniques215 Questions
Exam 4: Data Collection and Sampling82 Questions
Exam 5: Probability200 Questions
Exam 6: Random Variables and Discrete Probability Distributions158 Questions
Exam 7: Continuous Probability Distributions149 Questions
Exam 8: Sampling Distributions127 Questions
Exam 9: Introduction to Estimation85 Questions
Exam 10: Introduction to Hypothesis Testing178 Questions
Exam 11: Inference About a Population75 Questions
Exam 12: Inference About Comparing Two Populations, Part 183 Questions
Exam 13: Inference About Comparing Two Populations, Part 284 Questions
Exam 14: Analysis of Variance125 Questions
Exam 15: Chi-Squared Tests118 Questions
Exam 16: Simple Linear Regression and Correlation231 Questions
Exam 17: Multiple Regression143 Questions
Exam 18: Review of Statistical Inference182 Questions
Select questions type
Student's Final Grade: A statistics professor investigated some of the factors that affect an individual student's final grade in her course. She proposed the multiple regression model 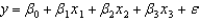 , where y is the final grade (out of 100 points), x1 is the number of lectures skipped, x2 is the number of late assignments, and x3 is the midterm exam score (out of 100). The professor recorded the data for 50 randomly selected students. The computer output is shown below.
THE REGRESSION EQUATION IS
, where y is the final grade (out of 100 points), x1 is the number of lectures skipped, x2 is the number of late assignments, and x3 is the midterm exam score (out of 100). The professor recorded the data for 50 randomly selected students. The computer output is shown below.
THE REGRESSION EQUATION IS 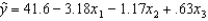

 ANALYSIS OF VARIANCE
 -What is the coefficient of determination? What does this statistic tell you?
(Essay)
4.9/5  (40)
(40)
Student's Final Grade: A statistics professor investigated some of the factors that affect an individual student's final grade in her course. She proposed the multiple regression model , where y is the final grade (out of 100 points), x1 is the number of lectures skipped, x2 is the number of late assignments, and x3 is the midterm exam score (out of 100). The professor recorded the data for 50 randomly selected students. The computer output is shown below.
THE REGRESSION EQUATION IS ANALYSIS OF VARIANCE
-Does this data provide enough evidence at the 5% significance level to conclude that the final grade and the number of late assignments are negatively linearly related?
(Essay)
4.9/5 (39)
A multiple regression model involves 40 observations and 4 independent variables produces a total variation in y of 100,000 and SSR = 80,400. Then, the value of MSE is 560.
(True/False)
4.8/5 (33)
Filters
- Essay(0)
- Multiple Choice(0)
- Short Answer(0)
- True False(0)
- Matching(0)