Exam 17: Multiple Regression
Exam 1: What Is Statistics39 Questions
Exam 2: Graphical and Tabular Descriptive Techniques192 Questions
Exam 3: Numerical Descriptive Techniques215 Questions
Exam 4: Data Collection and Sampling82 Questions
Exam 5: Probability200 Questions
Exam 6: Random Variables and Discrete Probability Distributions158 Questions
Exam 7: Continuous Probability Distributions149 Questions
Exam 8: Sampling Distributions127 Questions
Exam 9: Introduction to Estimation85 Questions
Exam 10: Introduction to Hypothesis Testing178 Questions
Exam 11: Inference About a Population75 Questions
Exam 12: Inference About Comparing Two Populations, Part 183 Questions
Exam 13: Inference About Comparing Two Populations, Part 284 Questions
Exam 14: Analysis of Variance125 Questions
Exam 15: Chi-Squared Tests118 Questions
Exam 16: Simple Linear Regression and Correlation231 Questions
Exam 17: Multiple Regression143 Questions
Exam 18: Review of Statistical Inference182 Questions
Select questions type
____________________ is a condition that exists when independent variables are correlated with one another.
(Short Answer)
4.9/5  (37)
(37)
In a multiple regression model, the following statistics are given: SSE = 100, R2 = 0.995, k = 5, and n = 15. Then, the coefficient of determination adjusted for degrees of freedom is:
(Multiple Choice)
4.9/5 (34)
In multiple regression analysis, when the response surface (the graphical depiction of the regression equation) hits every single point, the sum of squares for error SSE = 0, the standard error of estimate s = 0, and the coefficient of determination R2 = 1.
(True/False)
4.9/5 (37)
In regression analysis, the total variation in the dependent variable y, measured by  , can be decomposed into two parts: the explained variation, measured by SSR, and the unexplained variation, measured by SSE.
(True/False)
4.8/5 (30)
In multiple regression analysis, the ratio MSR/MSE yields the:
(Multiple Choice)
4.9/5 (36)
Multicollinearity affects the t-tests of the individual coefficients as well as the F-test in the analysis of variance for regression because the F-test combines the t-tests into a single test.
(True/False)
5.0/5 (33)
A multiple regression analysis involving three independent variables and 25 data points results in a value of 0.769 for the unadjusted coefficient of determination. Then, the adjusted coefficient of determination is:
(Multiple Choice)
4.7/5 (33)
In a multiple regression analysis involving 4 independent variables and 30 data points, the number of degrees of freedom associated with the sum of squares for error, SSE, is 25.
(True/False)
4.8/5 (35)
One method of diagnosing heteroscedasticity is to plot the residuals against the predicted values of y, then look for a change in the spread of the plotted values.
(True/False)
4.7/5 (39)
In multiple regression analysis, the adjusted coefficient of determination is adjusted for the number of independent variables and the sample size.
(True/False)
4.9/5 (36)
Student's Final Grade: A statistics professor investigated some of the factors that affect an individual student's final grade in her course. She proposed the multiple regression model  , where y is the final grade (out of 100 points), x1 is the number of lectures skipped, x2 is the number of late assignments, and x3 is the midterm exam score (out of 100). The professor recorded the data for 50 randomly selected students. The computer output is shown below.
THE REGRESSION EQUATION IS
, where y is the final grade (out of 100 points), x1 is the number of lectures skipped, x2 is the number of late assignments, and x3 is the midterm exam score (out of 100). The professor recorded the data for 50 randomly selected students. The computer output is shown below.
THE REGRESSION EQUATION IS 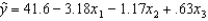

 ANALYSIS OF VARIANCE
 -Does this data provide enough evidence at the 1% significance level to conclude that the final grade and the midterm exam score are positively linearly related?
(Essay)
5.0/5 (34)
In order to test the validity of a multiple regression model involving 5 independent variables and 30 observations, the numerator and denominator degrees of freedom for the critical value of F are, respectively,
(Multiple Choice)
4.8/5 (42)
If multicollinearity exists among the independent variables included in a multiple regression model, then:
(Multiple Choice)
4.9/5 (31)
When the independent variables are correlated with one another in a multiple regression analysis, this condition is called:
(Multiple Choice)
4.7/5 (41)
A(n) ____________________ value of the F-test statistic indicates that the multiple regression model is valid.
(Short Answer)
4.8/5 (37)
Real Estate Builder: A real estate builder wishes to determine how house size is influenced by family income, family size, and education of the head of household. House size is measured in hundreds of square feet, income is measured in thousands of dollars, and education is measured in years. A partial computer output is shown below.
SUMMARY OUTPUT
 ANOVA
ANOVA

 -Interpret the value of the Adjusted R-Square.
(Essay)
4.9/5 (36)
The least squares method requires that the variance  of the error variable is a constant no matter what the value of x is. When this requirement is violated, the condition is called:
(Multiple Choice)
4.9/5 (30)
A multiple regression model is assessed to be poor if the error sum of squares SSE and the standard error of estimate s are both large, the coefficient of determination R2 is close to 0, and the value of the test statistic F is large.
(True/False)
4.7/5 (31)
Filters
- Essay(0)
- Multiple Choice(0)
- Short Answer(0)
- True False(0)
- Matching(0)